At the University of Chicago’s 2017 “The Impact of the Digital on Japanese Studies” workshop, scholars from a variety of fields and foci questioned how digital methods are currently or could potentially change the way we approach Japanese Studies research. There, I took a critical and exploratory approach to determine how and if these tools were useful within my own work on medieval Japan mapping and analyzing sixteenth-century documentary communication networks. In experimenting with network analysis and mapping tools using a portion of my corpus as a basis, I found both great potential in reevaluating my present conclusions and knowledge through the digital as well as drawbacks to engaging these methods of analysis. Digital tools provide an innovative way to approach humanistic data that any historian may benefit from, although as with all methods, it should be employed with thoughtful caution. Below I highlight the process of engaging network analysis to visualize sixteenth-century documentary exchanges.
Sources and Goals
The Matsugike monjo 真継家文書 (Matsugi Family Documents) is a set of over 6,000 documents ranging from the twelfth to nineteenth century. The medieval portion and its supplementary materials (published as Chūsei imoji shiryo 中世鋳物師史料 by Nagoya University and compiled by Amino Yoshihiko in 1982) comprises several hundred records, including aristocratic tax decrees, warlord letters negotiating access to casters, and forged histories of metal caster associations.1
I use the Matsugi collection as a source of information on socioeconomic networks established by the courtier Matsugi Hisanao in Kyoto, who spearheaded collaboration among warriors and metal caster associations in the provinces through documentary interactions. I therefore created network visualizations of the person-to-person connections established through letters as a test case with two main goals: 1) to determine whether or not and how digital tools could provide new insights into these communication networks, and 2) to find out if these materials were too problematic and too few in number to effectively use with certain digital methods.
Tools and Methods
There are a number of network visualization tools available such as, Cytoscape, gephi, Palladio, NodeXL, etc. For all, the learning curve can be quite steep, so although Cytoscape is potentially among one of the less powerful tools for analyzing networks, it was a good option for a beginner like myself.2
My first task was to create data sets for use in Cytoscape, in this case, information on 168 letters exchanged in a roughly 100-year span between courtiers in Kyoto and warrior and caster figures in the province. I carefully cataloged information on my documents, noting the title, document type, collection number, sender, recipient, the recipient’s social group, status within that social group if applicable (i.e., were they a highly-placed daimyo as opposed to a local kokujin warrior), and the date of the document. This was overambitious, as one of the limitations of any visualization is the number of elements you can represent at once. I narrowed my fields and chose to organize my network by names (sender/recipient), social group, status, and document.
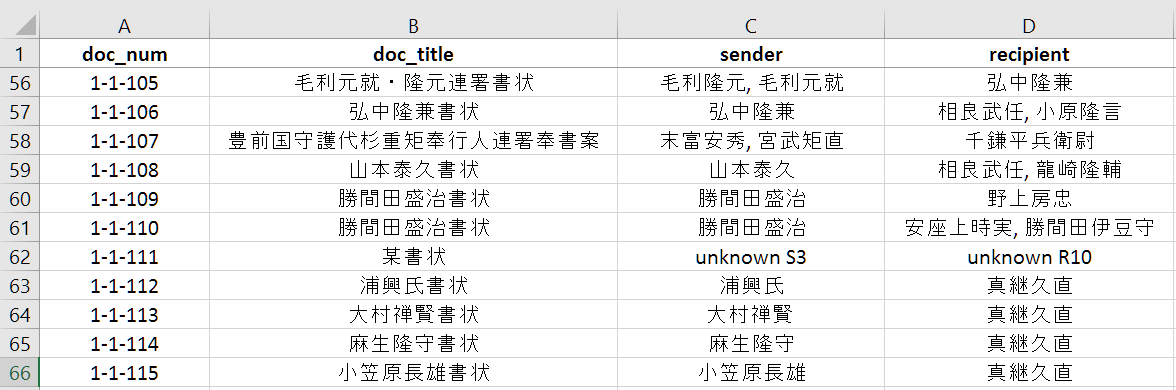
I prioritized the senders and recipients as my nodes (simplistically put, start and end points) and the documents themselves, represented by their archival titles, as my interaction (edge) in a directed network (directed indicating a relationship in which an exchange happens). Two charts were produced: one asserting the nodes and edges, and one defining the characteristics of the nodes.
Note that in the above table there are a number of "unknown" figures with S# or R# labels. One discovery I made in the visualization data process is that Cytoscape would collapse names that were the same. Thus, if the sender or recipient of a letter was unknown and they were not given a unique label, the program erroneously assumed they were all the same person.
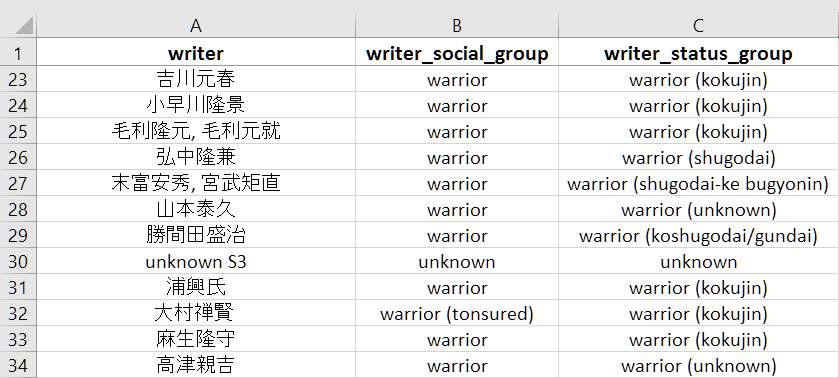
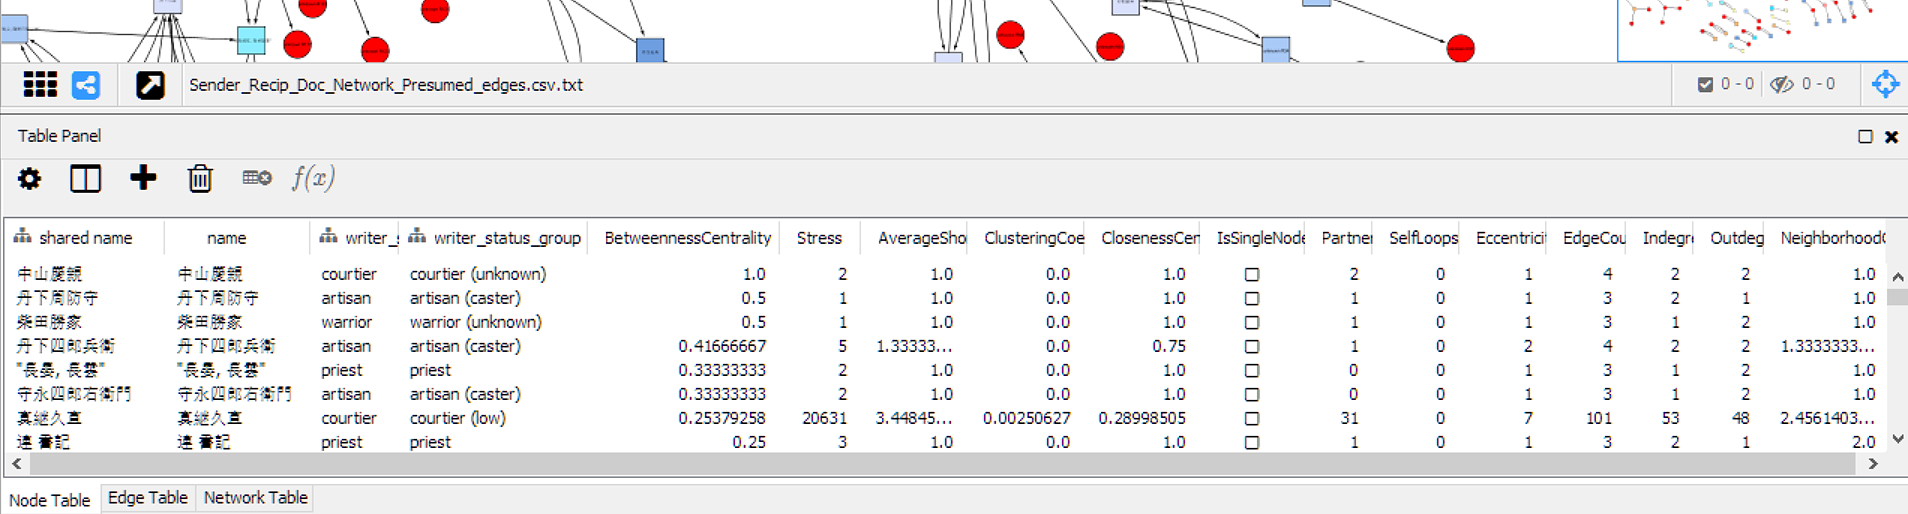
For the descriptive attributes of each node, I was interested in seeing how the network operated across social groups (warriors, courtiers, artisans, etc.) and the status (high or low) therein. In part, this is because my corpus of letters demonstrates the hierarchy of passing orders down from daimyo to kokujin through several layers of command. The chart below shows my node attribute table, where I indicated which writer from the edges table (sender or recipient, all placed in a single list in which they appear only once) coincided with which descriptive attribute by social group and status.
Note that both the edges and nodes table have instances in which multiple figures are listed as a single recipient. This is another complication born of the nature of the documents. When there are joint signature documents, or single documents that passed through the hands of more than one person how should they be coded? It is necessary to make judgment calls for the sake of visualizing your network. Here, I indicated letters with multiple senders or recipients as a single edge, since groups of bugyōnin in my letter set often were the same three or four people each time.
For the visualization process in Cytoscape, I selected shapes and colors specific to the descriptive attributes that characterized my nodes (senders/recipients):
triangles = courtier
squares = warriors
circles = artisans
hexagons = priests
parallelogram = merchants
I used color to indicate status within that social group— darker colors the higher the status, lighter the lower the status. Of course, these categories must necessarily be blunt instruments meant for exploration—real life is messy, with artisans and warriors that held court titles, producers of goods that also acted as their own merchants, warriors that eventually took the tonsure, etc. complicating these simplistic categories.
Visualizations and Obstacles as Methodological Process
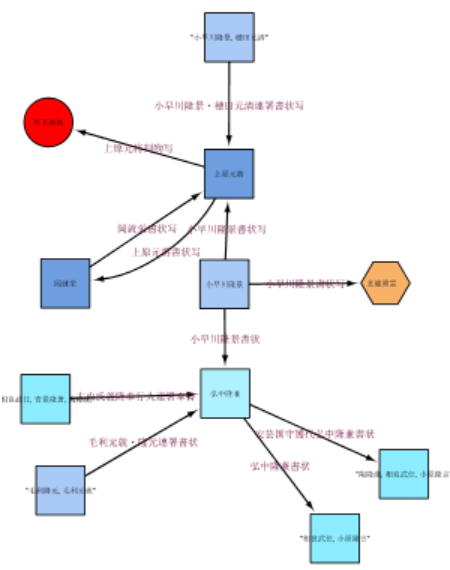
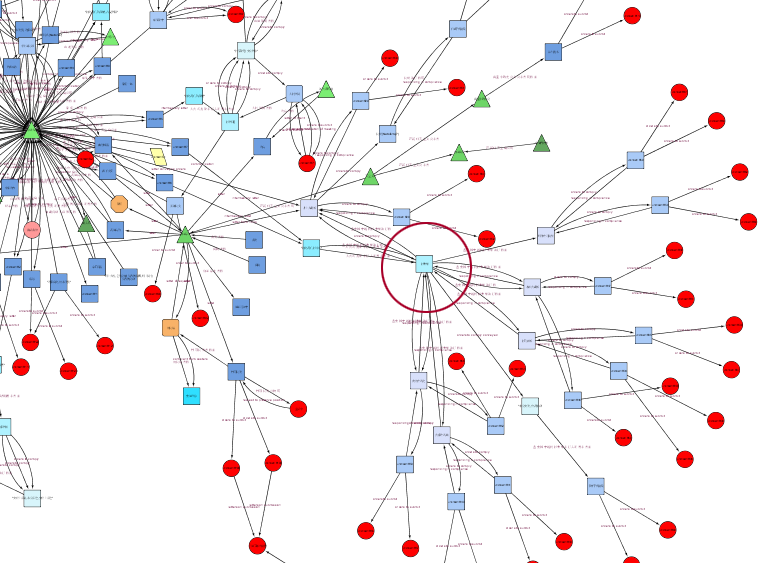
After several false starts that required tweaking my data, I finally produced the visualization of my extant document network, seen below. Throughout my project, I have focused particularly on Matsugi Hisanao, the low-ranking courtier responsible for initiating the networks in question and consolidating his family’s claim to levies of goods or cash from metal caster organizations by negotiating with them through their provincial warrior patrons. In this visualization, we see that the focal point of the connections demonstrates what my project presumed to be true— that Hisanao (the centrally located green triangle in the visualization) lays at the core of this network of communication, and was vital to our network of exchange. Note the metal caster artisans in red, who appear sparsely. We also see that certain exchanges, such as the blue and purple interaction seen below the main network, lie helplessly disconnected from the central pathways, even though we understand them from the documentary content that these figures and their letters are related to our larger network.
This issue of figures disconnected from the main network and the scarcity of artisans (whom, from reading the content, we know were important participants in these social relationships) is also linked to one of the main problems in studying the late medieval documents and commoners in general— a dearth of sources. The network produced above is not only from a fairly small corpus of documents, but a much greater number of letters must have existed that were never preserved. Even within the set used, a good 3/5ths of the documents all originate from the Ōuchi family, while others were not so fortunate, creating an inherent bias in the data represented and suggesting that other interactions may have been just as prolific despite a lack of evidence to that effect.
How, then, can we compensate for the missing documents and use their absence to think critically about my networks? Who else sent letters? What petitions had to be submitted in order for documents X, Y, and Z to be produced? When an enforcement order was issued, who received it, and who received that order subsequent to that? What clues in the text pointed to those letters lost?
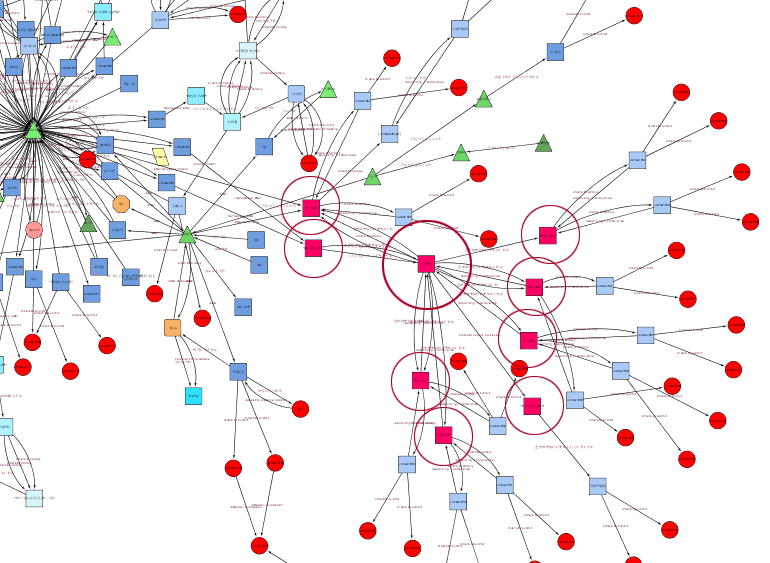
My second task became to visualize a network of presumed exchanges, taking for granted documents that would have likely existed based on the content of those that did. I carefully reread each of my documents, and from the content and conventions of social structure and exchange, coded these presumed materials into my network. The result was this second visualization.
Any time a letter mentioned a previous letter, intent to reply, suggestions of another exchange, etc., I included this in my data set. Furthermore, any time orders were given to a middle-ranking warrior who would have had the responsibility to convey them to a lower local warrior, who then would have to convey them to local artisan organizations, I hypothesized (for the sake of data) that two such local lords existed, and two caster organizations for each lord. This is not a stretch, but perhaps even an underestimation of how many local warriors or artisans may have been involved in these interactions.
As historians, we operate on the assumption of these gaps, asserting that X was likely written or Y can be said from what surviving documents tell us. In this case, creating data from our surviving documents to visualize those assumptions allows us to experiment with new perspectives on these communicative interactions and reflect on the problems and possibilities such data brings to light.
Some Insights and Avenues of Exploration
On a visual level, this new representation of known and presumed letter exchanges provides some initial insights. A cursory examination of the second (presumed document) visualization demonstrates that casters, who overwhelmingly lack surviving documentary representation despite a likely rich history of written exchange, suddenly become a very visible part of our network, proliferating at its edges with red circles. Several possibilities for their absence in our extant network present themselves— that letters sent by courtiers and warriors to casters and casters to them were simply lost, that such letters were destroyed by either party as objects without particular value, or that a portion of or most communication occurred orally. However, this visualization repopulates our communication network, if only theoretically, with rich connections to these commoners that are instructive when providing visual means of communicating their prevalence to an audience.
Similarly, we also get a much more concrete sense than before about the aforementioned hierarchy of exchange, especially when we observe the branch of Ōuchi-related documents. Take, for example, our bugyōnin (warrior magistrate) Sugi Shigenori, the central light blue square in the extant document visualization to the right. He conveyed Hisanao’s requests down the line to Ōuchi followers. We see that his exchanges form a spiral pattern back and forth, which is visible in the bottom of the larger extant document network as a disconnected unit because we lack the documents directly from Hisanao to Shigenori or Shigenori to the daimyo, Ōuchi Yoshitaka. The visualization of this sub-network shows letters sent back and forth among lower-level Ōuchi followers as he sent them orders.
If we look at the new visualization of these exchanges within the presumed network (left), We find Sugi Shigenori (again, the light blue square, this time seen towards the left-hand side of the image) is a central point of connectivity to a much larger group of individuals and also connected by a variety of letters to the rest of the network (not visible here). When missing letters (either from Hisanao directly to Sugi or from Hisanao to Ōuchi Yoshitaka to Sugi) are included in the data set, we can see how communication fanned out from the center to Shigenori, down the chain of command of the warrior network, and further on to metal casting artisans, reconnecting these individuals to the larger web of communications and including the non-warrior commoners at the opposite ends of the network.
But outside of the visual, what mathematical tools, an integral part of systems like Cytoscape and other network analysis tools, might be useful for thinking about these two networks?
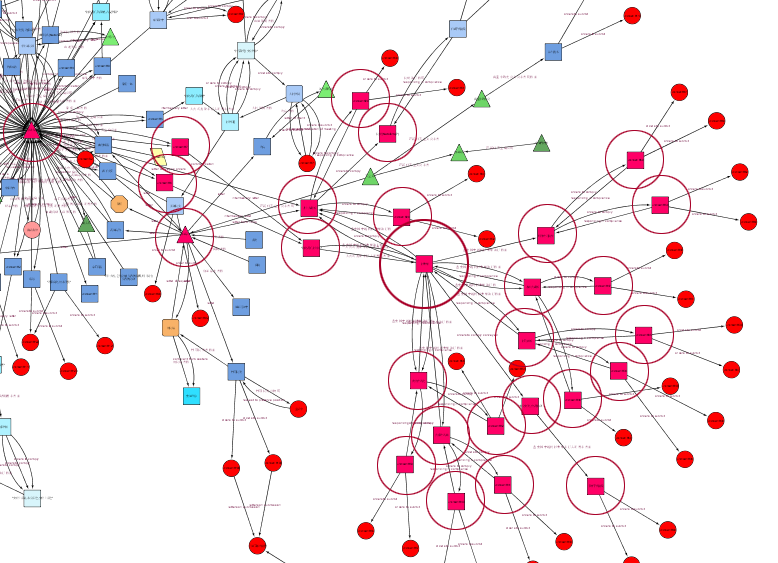
Network visualization software offers various tools for extracting patterns within these networks, a few of which I will offer some simplified explanations of here. One is first neighbor selection— with this, it is possible to select a given edge—in this case, a person and to easily highlight the first wave of people connected to that one individual. This process can be repeated over and over, and provides a means to see just how easily a network or branch of a network could collapse or reorder itself if you select and remove a single individual from the network.
Above, you can see three stages of first neighbor selection. On the left, as the subject of our neighbor analysis, Sugi Shigenori is circled (my emphasis). With one round of first neighbor selection (center), we find that those figures immediately connected to him via letter exchange are now selected. Running first neighbor selection a second time (right), the next wave of connectivity becomes apparent, following the spread of the network outward. This allows for easy extraction of a subnetwork within the overall interactions.
The network analysis metrics in Cytoscape also provide mathematical analyses that make it possible to compare the connectivity of individual nodes and understand who the most active players are. This was particularly useful with two networks to compare. For example, I looked at two measurements in each: betweenness centrality and stress centrality. Betweenness centrality measures the ratio of shortest paths to a given item, while stress centrality measures the number of shortest paths passing through the item. Both of these are useful for thinking about how integral an individual is to our overall network.
Matsugi Hisanao, for example, has a betweenness centrality of 0.144 in my extant document network, and 0.253 in my presumed network, and his stress centrality is 428 in my existing document network, and 20,631 in my presumed document network. This preliminarily suggests that his significance in our networks of exchange would be only further proven by the existence of more documents in our overall network. We might, however, find the opposite to be true of other participants— for other individuals, we might have assumed that they were figures of great importance, only to discover with presumptive documentary inclusions that this status could relatively decline with the inclusion of other data. This offers another angle from which to view these exchanges as a whole and could shift our theories about the importance of certain individuals or groups geographically or socially.
Problematics and Limitations
Issues with materials and data creation
In the end, there are a great deal of limitations and caveats that come with attempting to visualize networks that are necessarily incomplete and based on humanistic materials. The first and most obvious has to do with cleaning data— medieval documents at their best are sparse in number compared to modern collections and at their worst can be impenetrably vague. A good number of the Matsugi-related documents include references to individuals about whom we can only speculate by their honorifics, who fail to sign their letters, or whose surnames or given names are lost. They often refer to their locations only by a vague identifiers— “this province,” “this harbor,” “the foundry of such and such a village,” which makes it next to impossible, without a whole host of corroborating evidence, to identify where and to whom many of these documents are going.
Then, as previously mentioned, there is the issue of multiple senders or recipients. Should these figures be considered a unit, or should they be considered individually? Does the joint signature suggest that copies were also made of their documents distributed to each of them? Your individualistic interpretation determines the data produced, and in turn, numerical analytics may shift in your network in response. This also raises questions of the invisible figures who facilitated these exchanges. “I will convey the rest in person to the messenger,” many of these documents end, and who this person was or where they went disappears in the narrative. They, too, were a part of these communication networks.
No less so the metal casters, whose personal documents rarely survive. We know only from their voices, occasionally quoted and embedded within the writings of the elite, that they were bold and autonomous figures who had a strong say in where their business went. We know from surviving materials that Hisanao went to them directly to negotiate, and so we must include them, somehow, in our data sets, but as an assumption, a fabrication, using an intuitive understanding of the way things worked. What should we call this kind of data, then, and how should we represent it? How, furthermore, do we include the other external complications that come with these documents, such as the document’s journey to the final collection where it was later found?
Issues with technology and data representation
On the technical side a number of issues remain. From the start, I underwent extensive troubleshooting to get Cytoscape to accept Japanese language inputs in certain files, converting back and forth from various file formats to get UTF-8 encoding accepted. A number of other programs can also be finicky about Asian language text, so this is something to be aware of.
In the program itself, there can also be errors in the reading and representation of data. A close look at my extant document network shows that some figures' node attributes do not match their ultimate visualization. Attempts to correct them were not successful, so there is an equal possibility of human error and computational error in the program.
Then, there is the matter of the metrics. Entire courses could be taught on understanding the mathematical and scientific tools embedded in tools like Cytoscape (which was originally created for mapping protein-protein interactions). Without tutoring in the analytical side of numerical outputs like between centrality and stress centrality, the likelihood for error remains. For example, comparing certain types of network centrality in our extant document network between, say, the large network with Matsugi Hisanao at the center and a smaller cluster might return false emphasis- a figure in a smaller network could, by comparison, appear far more important numerically because there are fewer connections to draw emphasis away from him than with a more substantive clustering of interactions. Contextualizing analytic results is essential.
Finally, there is the necessity of forcing humanistic data to fit the rigid standards of scientific formatting. In some cases, (as with the mapping [missing link] examples), certain computational interfaces will not accept incomplete or missing data, forcing us to either exclude materials with partial or significant gaps or fill them with our best guesses. Again, the element of humanistic interpretation must make up for deficiencies in the digital tool, or the reverse.
Conclusions
It goes without saying that the above issues elicit a wariness on the part of the historian towards embracing digital methods, given the potential unreliability of creating, cleaning, and evaluating data as well as the time investment for mastering such tools. The above example is but a toe-dip in a much deeper pool. In the end, I found these hurdles as problematic as thought-provoking in trying to represent the complex relationships in my research in a new, visually concrete form. The necessity to input something when documents gave me only the unknown, or to define relationships or characteristics that defy categorization, both jarred me and motivated me to think more critically about what we can and can’t know about our historical subjects from the content and characteristics of documents. In the case of missing documents, I saw a new way to envision what I had already imagined to be true. These visualizations and the analytic possibilities they pose, as a methodological exercise prompt new areas of thought and analysis, and allow us to refocus and reinterpret humanistic data with fresh eyes.
For the mapping portion of this digital exercise, continue on to the next section.
Return to top.