East Asia-related Job Market Data Report (2024–2025)
Published January 20, 2026
This page compiles information and visualizations on academic-oriented job postings related to East Asia during the 2024–2025 hiring season (from approximately June 2024 to July 2025). This year also marks five years since I began collecting East Asia-related job data, so reflections on the five-year trends for each section and/or subsection will also appear. For more information on how and why I began this project, please see my first visualization page for the 2019–2020 academic job cycle.
For the sake of convenience and to address any changes in my methods since last year, I will reproduce my explanations on data collection from previous cycles below, and mark new elements in bold and/or with a star ★.
To jump directly to the visualizations, click here.
I hope that the information provided on this page will facilitate further dialogue on current and future developments in the East Asian Studies fields and will be used by departments and individuals to advocate for this area of study at their institutions. If you have any questions about the data or would like to request specific visualizations for departmental reports, grant requests, or other proposals (or have used my work for this purpose already), please do not hesitate to contact me.
I am also presently collecting information on East Asia-related job advertisements for the 2025–2026 academic cycle. If you see a relevant ad not already included in the data in progress filter table, particularly for institutions outside the Anglophone world, please use the following form to contribute to the dataset:
About the Data: Sources
The data gathered for this exploration originated from numerous websites (★ represent those sources that were newly incorporated this job cycle):
This data should NOT be considered 100% comprehensive (see caveats below), merely reflective of information provided on some of the most commonly-used job search portals for academic postings related to East Asia by scholars (often in Anglophone circles).
About the Data: Caveats
As with previous reports, I begin by noting that data is messy. This is a reflection of the job ads themselves, which are even messier. A job ad might ask for something fairly specific, like a historian of contemporary China focusing on the environmental humanities, or simply list “East Asian Studies” with no additional information on a desired time period, specialization, or other qualifications. Because job ads are inconsistent in the terminology used to describe some academic positions, I have chosen not to do a vocabulary-based comparison on desired disciplinary expertise here. However, if you are interested in exploring the key terms that appeared in job ads for the 2024–2025 market cycle, you can find a searchable table of them here. For the purposes of producing this dataset, job ad language was taken at face value, and cannot account for any internal criteria that informed the scope of searches. How data is represented is also interpreted through the compiler. Others might have organized or categorized this data differently than I have.
Although I continue to increase the number of sources I use to locate job advertisements and solicit postings from colleagues outside of primarily English-speaking areas, the data presented here is also reflective of both an English-language/North American bias and Japanese bias. Many of the sites examined tend to focus on those positions, and job advertisements presented in other languages are only infrequently submitted to these venues, with the exception of Japan’s centralized job posting site, JREC-IN. Some postings also may pass through informal means (such as mailing lists) only or through alternative lists to which I do not have access. Furthermore, some schools either do not or cannot afford to post their job openings through more widely-known channels.
This list is not exhaustive with regards to jobs that one might consider “alt-ac” or “academic adjacent,” as I focused to the best of my ability on those ads that readily circulated on academic job searching platforms.
This year I incorporated job advertisements posted roughly between June 1, 2024 and July 31, 2025, along with the smattering of posts that went up until the publication of this report. This year I am able to do a five-year comparison, though data from the last 2-3 years should be considered the most accurate. This is not only because of the impact of the COVID-19 pandemic on the job market, but also because some job ad platforms were only later added, though I have done my best to include as much older data as was available when re-cleaning corpora from previous years.
About the Data: Cleaning and Organization
In an effort to produce meaningful visualizations comparing different job ads, I created eight different data categories. To review what each category and its accompanying labels mean (and how they were determined), click the individual tabs below.
The geographic location of the hiring institution.
The continental region in which the hiring institution is located.
The geographic regional coverage for which the job ad identified a preference. East Asian Studies and many humanities fields cite a primary region or nation of interest in their advertisements, whereas many social science fields have begun to replace regional or national focus with methodological preferences. This category was narrowed down from the ad content when possible. For example, if an ad listed “East Asian Studies/Asian Studies” for the title or topic of the position, but specified “preference for a candidate who can teach modern China,” then this posting’s “desired region” was labeled as “China.” Ads that included a particular combination of locations are identified separately. This year I refined these categories to reflect distinctions between ads that use "or" and "and" when requesting regional specializations in order to make more clear whether two options or both options are preferred. I also added more specificity to broad regional desires (such as "East Asia/Asia and South Asia"). Northeast Asia was the central focus of job data collected, though ads that had and/or and another broad regional category note the other preference as well. Job ads that were vague, such as positions in “non-Western” or “global” studies were not included. Job ads that listed three or more regional interests were not included for lack of specificity. Relevant Desired Region categories that have not yet appeared in the data do not appear below. - Asia (Pacific)
- Asia (Pacific) and Africa
- Asia (Pacific) and Middle East
- Asia (Pacific) or Africa
- Asia (Pacific) or Middle East
- Asia (Pacific) or South Asia
- China
- China and Africa
- China and Asia (Pacific)
- China and Global South
- China and Japan
- China and Korea
- China and Latin America
- China and South Asia
- China and Southeast Asia
- China and Taiwan
- China or Japan
- China or Korea
- China or South Asia ★
- China or Southeast Asia
- China or Taiwan ★
- East Asia, Asia
- East Asia/Asia and Africa
- East Asia/Asia and Global South
- East Asia/Asia and Latin America
- East Asia/Asia and Middle East ★
- East Asia/Asia and South Asia
- East Asia/Asia and Southeast Asia
- East Asia/Asia or Africa
- East Asia/Asia or Europe ★
- East Asia/Asia or Global South
- East Asia/Asia or Latin America
- East Asia/Asia or Middle East
- East Asia/Asia or South America ★
- East Asia/Asia or South Asia
- East Asia/Asia or Southeast Asia
- East Asia/Asia or the Americas ★
- Hong Kong
- Hong Kong and China
- Hong Kong or China
- Japan
- Japan and Korea
- Japan and Taiwan
- Japan or Korea
- Japan or Middle East
- Japan or Southeast Asia
- Korea
- Korea or Taiwan ★
- Taiwan
Data on the desired discipline identified in job ads was divided into labels that best distinguish the responsibilities of the position, based on the department hiring and/or description of the qualifications. Disciplines for which few postings were area-specific or that often advertise together (such as Political Science, Anthropology, and Sociology) are combined in the interest of visual legibility. The social sciences, in particular, pose challenges to data collection, as they do not often advertise region- or nation-specific positions and commonly list multiple disciplines together. Another challenge division is “Literature & Culture” and “East Asian/Asian Studies.” Often generalist positions in East Asian Studies are filled by specialists in literature and culture, complicating this distinction. Here, I have chosen to separate general positions that do not list a specific interest in literature/culture from job ads that specifically ask for a literature/culture specialist. Similarly, although there is often overlap between generalist instructors and language instructors (particularly at smaller institutions), the “Language” category applies to jobs looking primarily for language instructors, and those ads seeking sub-specialization in Translation, Interpretation, or Linguistics (which are more likely than Language to be tenure track) are separate categories.
- Administration, Program Director
- Any
- Archaeology
- Art History, Architecture, Urban Studies
- Business, Economics
- Digital Studies
- East Asian Studies, Asian Studies
- Editorial
- Education
- Environmental Studies
- Film Studies, Media Studies
- Gender Studies, Sexuality Studies
- Geography
- History
- Language
- Law
- Librarian, Library Services
- Linguistics
- Literature & Culture
- Museum, Curator, Conservation
- Music, Musicology
- Performing Arts, Drama
- Philosophy
- PoliSci, Anthro, Socio
- Public Health
- Public History
- Religious Studies
- Translation, Interpretation
The time period of the specialist desired in the job advertisement. - modern
- premodern (early modern [c. 18th/19th cen] and before)
- any (not specified or no preference)
- N/A (e.g.: most language instructors, administrative positions, etc.)
The track/security of the position. Contingent positions have been divided into jobs that are non-tenure track positions and postdocs, as the former typically applies to visiting or contracted positions and the latter often applies to research positions, sometimes with minimal teaching responsibilities. Adjunct positions, being extremely difficult to track and variable in their contract terms, are not included in this data. - TT (tenure track)
- non-TT (non-tenure track, contingent position; at least 1 year of full time job security)
- postdoc (non-tenure track, contingent position)
- N/A (jobs to which the specification of tenure or non-tenure track does not apply)
The labeling of institutions is based on its research output and degree-granting programs. This is perhaps the most problematic of the data organized, as, for the sake of comparison, each institution has been forced to fit into the rough equivalent of the US categories developed for The Carnegie Classification of Institutions of Higher Education. The Carnegie classifications do NOT consistently correlate with institutional rankings (also problematic). For UK-based institutions, I established R1 equivalents roughly based on the Russell Group categories. For Australian institutions, I drew on the Group of Eight. For Chinese institutions, I referred to current and defunct national funding initiatives such as the C9 League, the Double First Class University Plan, Project 985, and Project 211, as well as interpretive approaches based on the technical nature of the school's programs and overall diversity of doctoral or Master's programs. For other areas of Europe and Asia I consulted with colleagues based in those regions and provided a best guess based on advice. I fully acknowledge that these distinctions are problematic and often subjective. The most meaningful observations may be derived from considering the extremes—whether jobs appear more often at very large doctoral degree-granting institutions or small liberal arts institutions. In addition, the SLAC (small liberal arts college) category expanded this year to become SLAC/Bacc, recognizing the diversity of four-year baccalaureate institutions globally, particularly in China where, in contrast to locations like the United States, four year schools may have tens of thousands of students. Outside of conventional four year and postgraduate schools, there are also categories for institutions where jobs are available that may be outside the academic or tenure-track system. "Institute" may refer to research organizations, think tanks or other academic-oriented programs that are not explicit extensions of government programs. Such institutions are separately labeled "government." - R1 - very high research, doctoral program
- R1 regional branch - branch campuses of R1 institutions located in the US or abroad
- R2 - high research, doctoral program
- D/PU - Doctoral/Professional Universities
- M1 - high research, masters program
- M2 - medium research, masters program
- SLAC/Bacc - small liberal arts college or four-year undergraduate institution
- museum
- non-profit
- government
- library - institute
- seminary
- N/A
The type of institution. N/A indicates it is something different from a typical academic degree-granting institution, such as a language training school, etc. - public
- private
- N/A
The Data
Please review the caveats and labeling system provided above before viewing the data in order to best understand how and why it has been cleaned and organized as presented below. Please note that although comparisons will be made with the last five years of data, I work to improve my data collection methods every year, so one should be cautious not to interpret these numbers as absolute or infallible. Furthermore, for this analysis, I have also updated the previous five years of data to the best of my ability to account for newly incorporated job search websites and to provide more accurate multi-year comparisons. Past annual reports may not always reflect this corrected data. Comments specifically on multi-year data comparisons will be marked in blue to help visually distinguish commentary on long-term trends. Below, I have created several (non-exhaustive) visualizations based on my data using Tableau Public. All data visualizations, particularly interactive ones, will be best viewed in a browser. Please also note that postdocs were counted by the number of positions offered at a single university. For example, Yale University’s Council on East Asian Studies hires four postdocs per year for its general CEAS postdoc, so this is counted as four positions. Although job data comparisons at a global scale can be problematic given the sometimes vast differences between each country’s (or even institution’s) academic systems, I have done my best to create data categories that can reflect rough equivalencies. Each individual section will make special note of this when it needs to be addressed. The report is dense and readers often come to it seeking information on a specific discipline, period, location, or other tailored information. I have therefore included a jump navigation below for those who wish to navigate in a non-linear fashion. Navigation Overview & Continental RegionMap: Desired Discipline, Track, & Location
Desired Region
Desired Discipline
China
Japan
Korea
History
East Asian Studies and Literature & Culture
Language
Time Period
School Type
Public/Private
Top Hiring Institutions
A Glimpse into Digital Labor
Overview & Continental Region
The data collected for the 2024–2025 academic job cycle totaled 1,058 job advertisements globally. This marks an decrease of 148 ads from the previous year.The first year tracked, the 2020–2021 cycle, which has slightly less accurate data and also reflects the COVID-19 hiring freeze, had 677 job ads. Although this year's academic job market cycle began at roughly the same pace as the previous year, the sudden hiring freezes in early 2025 due to federal funding cuts in the United States likely stunted a significant number of hires, leading this year's decline.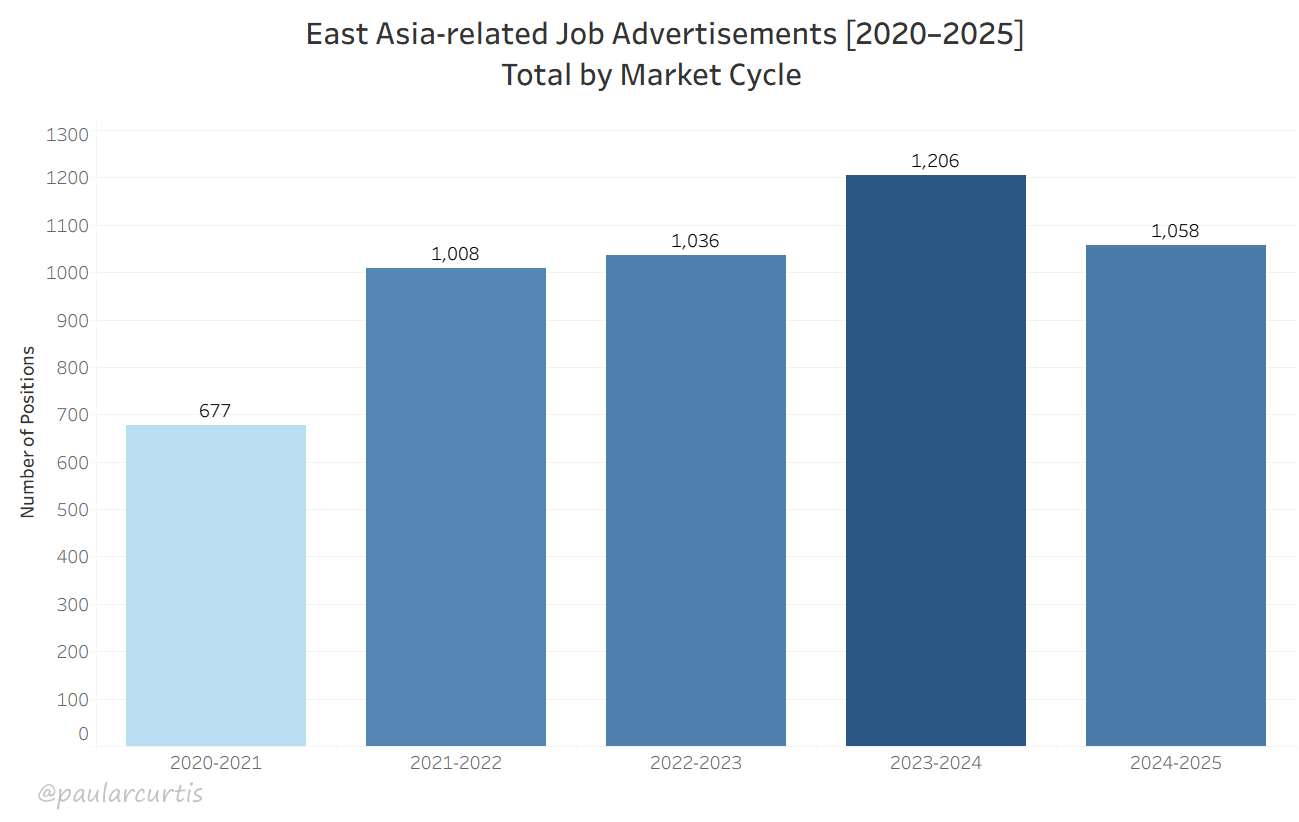
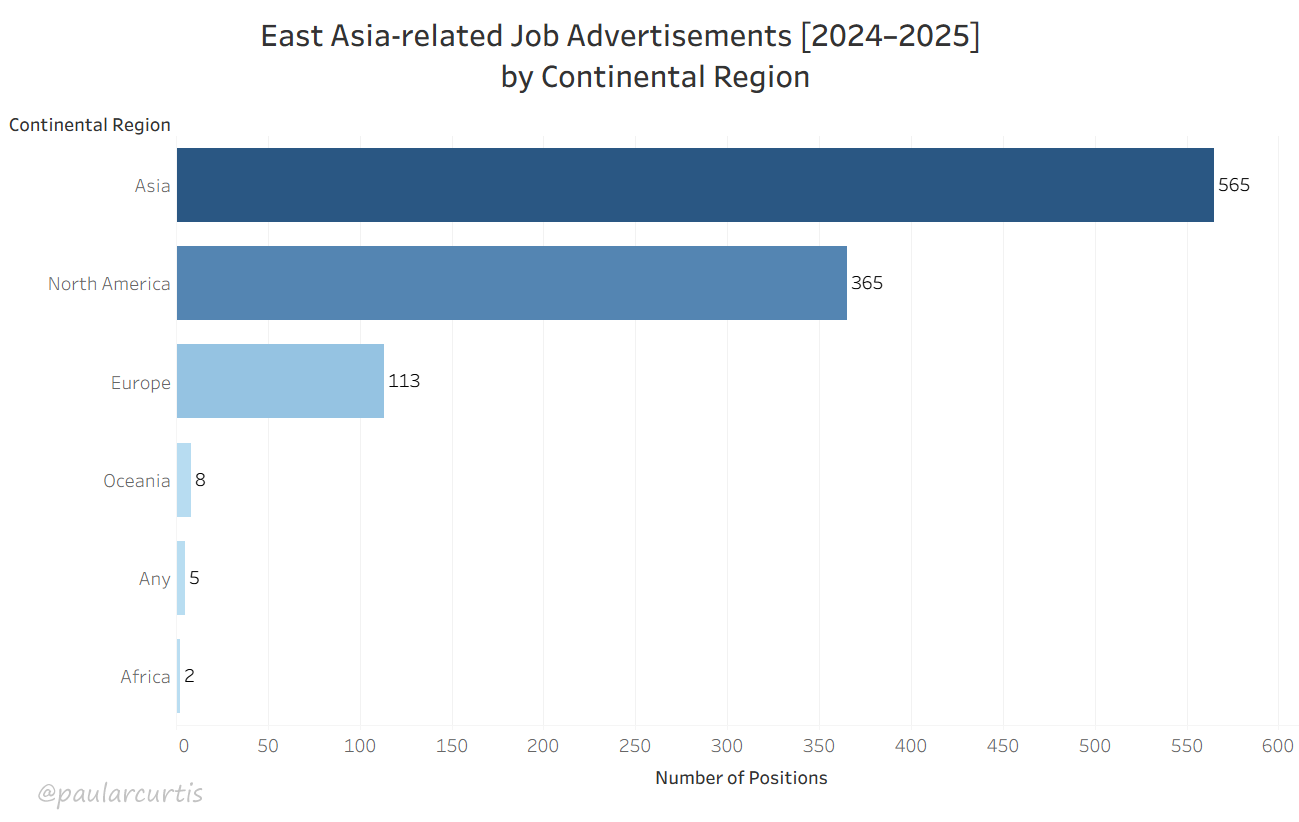
During the 2024–2025 market cycle there were 565 ads (53.4%) for job openings at Asia-based institutions. Institutions in North America were the second highest employer, accounting for 365 ads (34.5%), whereas Europe offered only 113 positions (10.7%). There were 8 ads in Oceania, 2 ads in Africa, and 5 ads with no particular continental region specified (e.g. remote postdocs not tied to an institution).
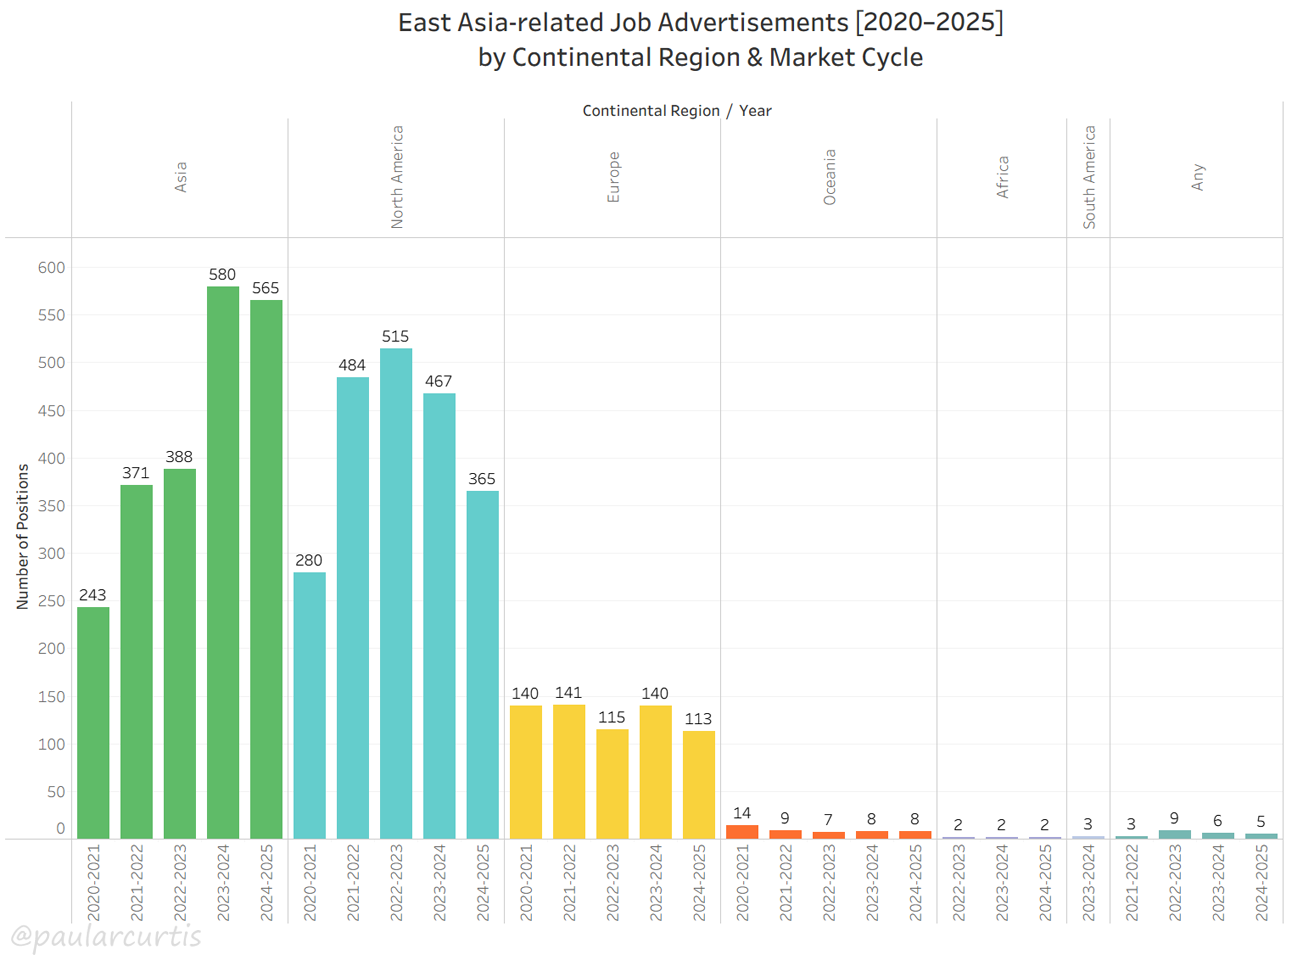
These trends are in keeping with the last market cycle, in which more job advertisements were released in Asia than North America (580 ads in Asia, vs. 467 ads in North America). On the whole, over the last five years there has been an increase in the number of job advertisements in Asia, complemented by a decline in North America. Notably, the gap between the two continental regions has widened. Whereas in the 2023–2024 market cycle Asia-based advertisements accounted for 48% of all ads, and North America-based ads accounted for 39%, in the 2024–2025 market cycle Asia-based ads were 53% and North America-based ads were 34%. Europe remains a steady 11-12%. Europe's job advertisement numbers have been on a seesaw trajectory, swinging from around 140 ads to around 115 ads year to year, on the downward turn this year. That said, Europe has generally accounted for between 10-11% of all ads globally for the last three years. The number of ads in Oceania (8 ads) and Africa (2 ads) were the same as last year, and more or less consistent with the last three market cycles.
There have been challenges for job seekers at either end of these five years of data collection, with the 2020–2021 job cycle impacted by the COVID-19 pandemic and the 2024–2025 federal hiring freezes in the U.S. halting many searches, which had implications well beyond North America. It is unclear at the present how these events will have an impact at a global scale for East Asian Studies.
Continental Regions: A Closer Look
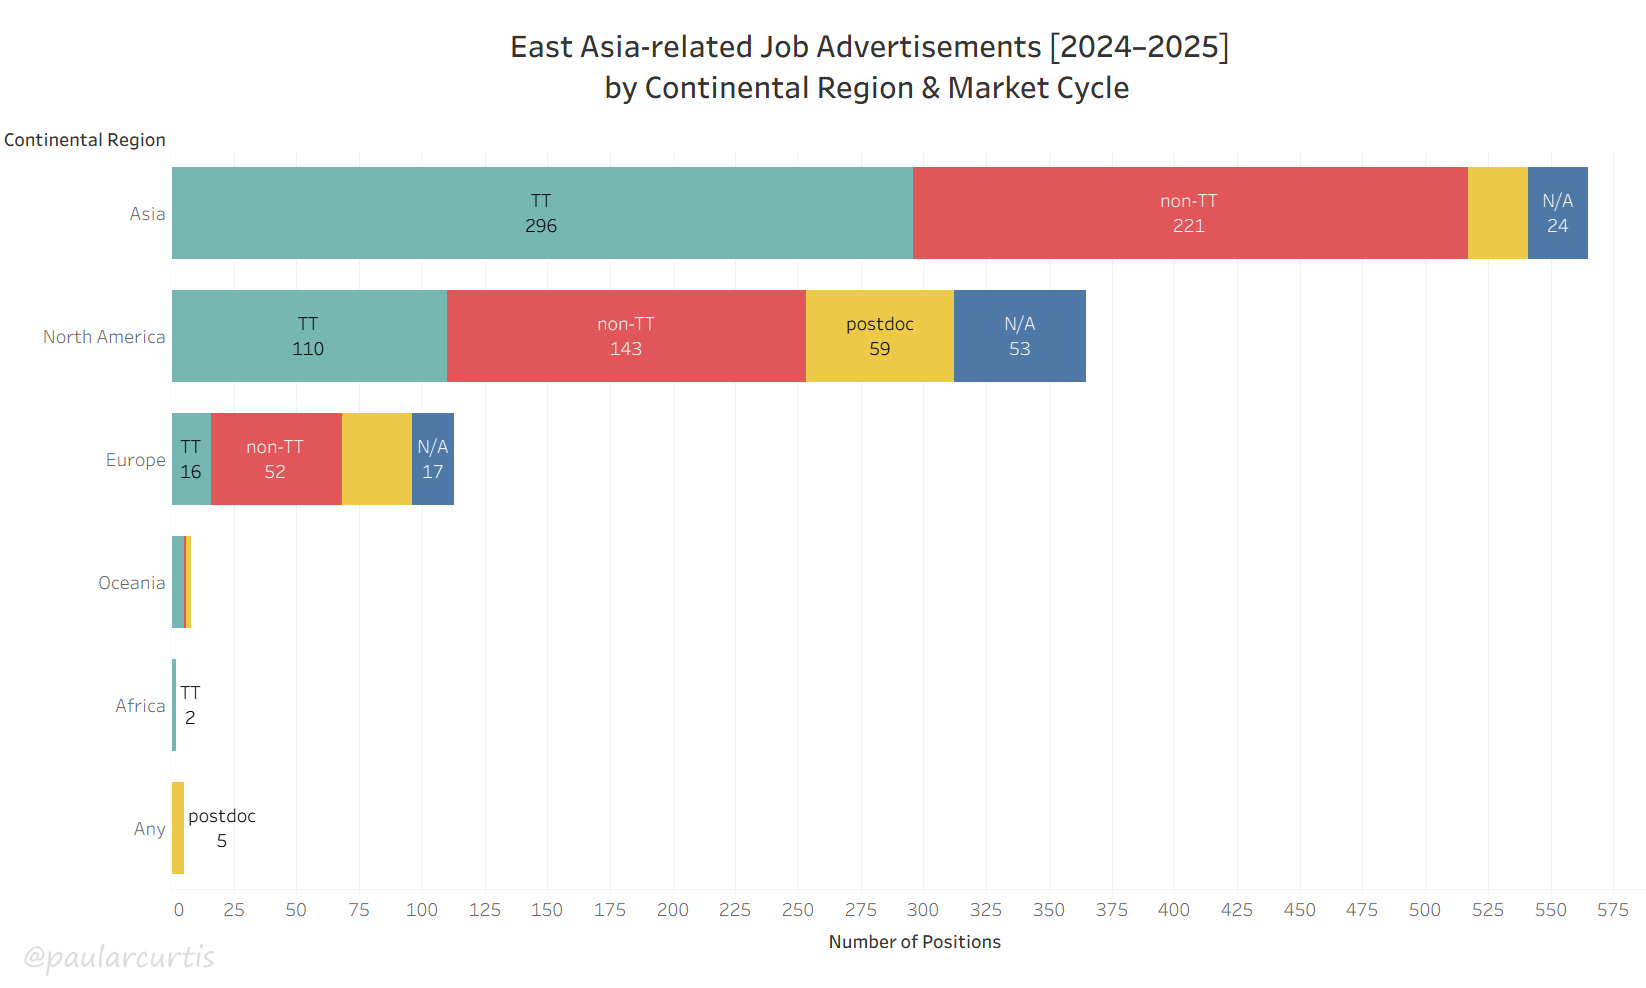
During the 2024–2025 market cycle, Asia hosted over half of East Asian Studies hires worldwide. Asia also hosted 69% of all tenure-track or tenure-equivalent hires. 55% of jobs offered in North America were contingent, and only 30% were TT. In Europe, only 14% of ads were permanent positions, a roughly 50% drop since last year.
If we consider hires by continental region for 2024–2025 by the track of the job advertised, we find that globally 429 job ads (40.5%) were for tenure-track (or tenure-track equivalent) positions and 535 job ads (50.6%) were for contingent (non-TT or postdoc) positions. There were 417 non-TT (39.4%) roles and 118 postdoc (11.2%) roles. The remaining 94 job ads (8.9%) were in the N/A category. The N/A category often accounts for positions that require East Asia/Asia-related expertise but fall outside the tenure system, such as administrative roles, some library or museum positions, etc. Asia hosted over half of East Asian Studies hires worldwide. Within Asia, 296 job ads (52.4%) were for tenure-track or TT-equivalent roles and 245 job ads (43.4%) were for contingent roles (221 non-TT, 24 postdocs). 24 ads were for N/A. 39.1% of contingent ads were for non-TT positions, and 4.2% were for postdocs. Asia-based tenure track job ads make up 69% of all TT job ads in East Asian Studies globally. The data for Asia has two important caveats. First, jobs in Japan are more readily advertised through jRec-in, a widely-used central database for academic job advertisements, whereas Chinese and Korean institutions tend to release annual batch advertisements in their respective languages that are not widely circulated to Anglophone circles or hire candidates internally. This creates a significant imbalance in representation. Second, in the case of China, the widely advertised jobs are primarily for one-year contracts recruiting foreign language teachers, which somewhat skews contingent data. Since 2020, there has been an overall growth in the number of advertisements based in Asia. Relatively permanent positions have not dipped below 40% of the jobs advertised there, with a boost from 48% to 52% in the last year (a five-year high). The percentage of non-TT job ads in Asia has hovered between 31% and 43% for the past five years, while postdoctoral roles have declined steadily from 16% in 2020 to roughly 4% this past market cycle. Though Japan-based positions dominate this data, these are more positive trends than we find in other continental regions. In North America, during the 2024–2025 market cycle, only 110 job ads (30.1%) were for tenure track positions, whereas over half, 202 ads (55.4%), were for contingent roles. 143 contingent ads (39.2%) were for non-TT positions (39.2%) and 59 contingent ads (16.2%) were for postdocs. This significantly higher number of postdocs is typical, as they are more often than not rooted in area studies centers that are more likely to exist in Anglophone contexts, rather than within Asia itself. For the N/A category, there were 53 ads (14.5%). North America accounted for 37.8% of contingent job ads and 25.6% of tenure track job ads worldwide. From 2020 on, it appeared that the North American market was slowly recovering, with the largest number of overall advertisements during the 2022–2023 market cycle and tenure track positions on the rise over a four-year period since COVID. However, the number of advertisements in North America dipped slightly in 2023–2024 (from 515 ads to 467 ads) and then dropped more sharply this year (to 365 ads). With the academic hiring freezes this year, there was an abrupt decline in the number of tenure track positions offered in North America. Tenure track positions went from 21% of the total ads in the North American market cycle in 2020 to 27%, 30%, 35%, and then this year, 30% again. By contrast, taken as a percentage of the whole, non-TT roles went from 42% in 2020 and 2021 to 37%, then 31%, and rose to 39% this year. For Europe, there were 113 ads total, of which only 16 ads were for permanent positions that would be considered roughly tenure-track equivalent. By contrast, 80 jobs (70.8% of all EAS ads in Europe) were contingent, with 52 ads (46%) being non-TT and 28 ads (24.8%) being postdocs. There were 17 N/A ads (15%). Due to the lower number of overall jobs, these percentages can look more dramatic than those for Asia and North America, but the situation is no less distressing. Since 2020, there has been an overall decline in the number of permanent positions in Europe, and a steady decline in the percentage of permanent positions relative to contingent roles. The decrease from 2023–2024 to 2024–2025 is particularly steep, going from 42 TT job ads last year to the 16 TT job ads this year. Permanent positions were 42% of offerings in Europe in 2020, 43% in 2021, but this year were only 14%. Contingent roles (non-TT and postdocs) were 51% of job ads in Europe in 2020, but are now 71%. Oceania on the whole has had very few job advertisements each market cycle. For 2024–2025 there were 8 job advertisements (4 in Australia and 4 in New Zealand), which is in keeping with last year's cycle (though last year 7 positions were in Australia and only 1 based in New Zealand). Of the job ads this year, 5 ads were tenure-track or TT-equivalent, 1 ad was non-TT, and 2 ads were postdocs. It is difficult to draw significant conclusions due to the overall lower number of positions available, but there were 7 TT advertisements in both the 2020–2021 and 2021–2022 market cycles. This year saw 2 job advertisements based in Africa (both at the American University in Cairo) and both were TT/TT equivalent. There were also 2 job ads in Africa in 2022–2023 and 2023–2024, though they were split between Egypt and Morocco as well as between TT and non-TT. This year there were no jobs located in South America that I could locate. In 2023–2024 there was one TT role advertised in Brazil and 2 postdocs, one based in Chile and one based in Peru.
Map: Desired Discipline, Track, & Location
The following visualization is an interactive map of all East Asia-related job postings for the 2024–2025 academic job market cycle by discipline, time period, track, and location. Clicking on information anywhere on the visualization or on the map below will generate its linked data across other fields. Hover over data points on the map to reveal information on the data point provided. Zooming in or out is also possible. Points on the map are sized to frequency, so a place with more job postings will have a point that appears larger than others. Click the title of the subcategory you're filtering or the area of the visualization you originally selected to void your selection and start over. Tableau can be finicky, so it may take a little experimentation. If interactive visualizations lag or generate an error, please refresh this page and try again. If an institution is listed in an unusual area, it may be that they are hiring someone for an overseas residency positions (e.g. University of North Georgia hiring for a resident director in Taiwan).Desired Region
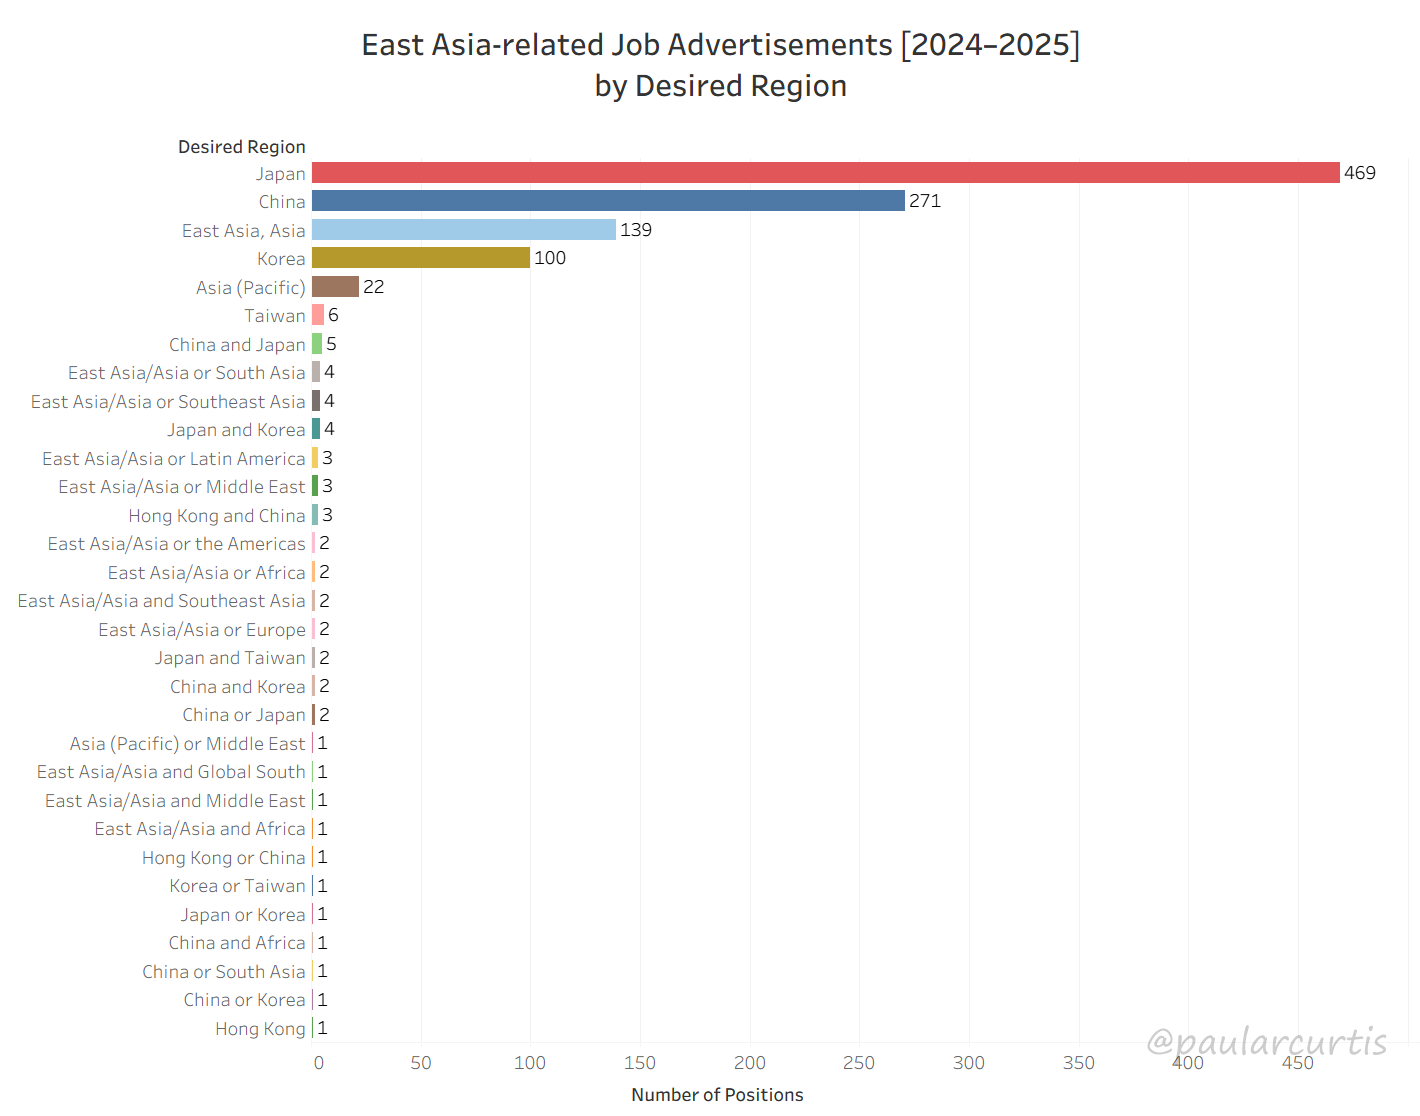
Globally, the most jobs were advertised for Japanese Studies specialists (biased heavily by jobs located in Japan), with approximately 44% of global jobs ads. Chinese Studies accounted for 26% of advertisements, and Korean Studies just under 10%. For the second year in a row the gap between Japan and China has widened in favor of Japan. Korea specialist roles declined slightly in number despite maintaining roughly the same percentage globally. North America was the continental region most likely to seek multiregional specialization from candidates.
Considering the region of specialization desired in East Asian Studies advertisements (including positions that do not necessarily fall into primarily academic roles), expertise in Japan was the leading area of interest (469 ads, or 44.3% of the global total), followed by China (271 ads, or 25.6% of the global total), then East Asia/Asia specialization (139 ads, or 13.1%), and Korea specialization (100 ads, or 9.5%). As previously noted, there is a heavy bias in the data toward Japan-focused jobs ads based in Japan. Were we to remove ads based in Japan, the prevalence of China specialist ads would surpass Japan, with 212 ads vs. 175 ads respectively, closing the distance of roughly 26% and 44% to become 33% to 27%. Korea-focused ads would rise by about 2%, (but their raw number would decrease from 100 ads to 73 ads). In addition, if we were to remove disciplinary categories that do not typically align with conventional tenure track lines (e.g. Administration, Program Director; Editorial, Language; Translation, Interpretation; Museum, Curator, Conservation; Librarian, Library Sciences), the gap would also close between Japanese and Chinese Studies positions going from 469 ads for Japan vs. 271 ads for China to 237 Japan ads vs. China’s 184 ads. For Korean Studies, this removal would drop from 100 advertisements to 54 ads. The exclusion of Japan-based jobs from the data in this case would sharply favor China, leading with 142 ads to Japan’s 79 ads; Korea-focused roles would only drop to 41 ads. These fluctuations and data biases are a reminder that, on the whole, it is more helpful to consider these comparisons within their continental regions. In Asia, the demand for Japanese Studies specialists far outpaced all others, accounting for 331 ads (58.6% of ads in Asia). Chinese Studies roles accounted for 116 ads (20.5%), while East Asia/Asia specialist positions (50 ads, 8.8%) and Korean Studies specialist positions (46 ads, 8.1%) were roughly equal. These trends are roughly in keeping with the previous year, though Japan-related roles increased by 9% and China-related roles decreased by 4%. From the perspective of percentage of the whole, in Asia China-related positions have steadily declined over the last five years, Japan-related positions have increased, and Korea-related positions have stayed the same. In North America, during the 2024–2025 market cycle there were more China-related advertisements than Japan-related ads. They were, however, closer in number, with 112 ads for China (30.7%) and 90 ads (24.7%) for Japan. The gap was also smaller between the next highest categories of the generalist East Asia/Asia specialist role with 66 ads (18.1%) and then Korea-related positions at 50 ads (13.7%). The number of jobs in all four of these top categories has declined in the last three years despite the brief post-COVID recovery. The percentages of each regional specialization compared to one another have remained largely the same for the past five years, with slightly more opportunities for China specialists. However, Language education is a notable exception, with Japanese outnumbering Chinese for the last five years. In Europe, the lower overall number of advertisements makes percentage comparisons slightly less meaningful, but Japan-focused advertisements (47 ads) lead slightly over China-focused advertisements, with Japan at 47 ads (41.6% of the whole) and China with 40 ads (35.4%). East Asia/Asia-related ads accounted for 13 ads (or 11.5%), while there were only four Korea-related ads (3.5%). Notably, from 2020 to 2024 Chinese Studies lead over Japan for desired region of specialization, but has been slowly declining as Japan slowly increases. Korean Studies has seen a slow and steady decline over the past five years (from 12 positions in 2020–2021 to only 4 this past market cycle). Oceania has offered too few of positions to assert clear trends, though this year there were 3 advertisements each for China and East Asia/Asia roles, 1 ad for Asia Pacific, 1 ad for Japan, and none for Korea.
Of the 1,058 positions advertised in the 2024–2025 market cycle, 211 ads (20%) desired more than one regional specialization from its candidates. This range of roughly 1/4th to 1/5th the total number of ads is more or less in keeping with trends for the last four years: 2023–2024 (23.5%), 2022–2023 (18%), 2021–2022 (22.5%). Over the past five years there have been 42 distinct multi-regional categories (including those that ask for “Place 1 AND Place 2” and “Place 1 OR Place 2”) in East Asian Studies job advertisements. The “East Asia/Asia” and “Asia (Pacific)” categories are consistently the most used every year. This year there were 26 multiregional categories globally, and the continental region most likely to demand multiregional specialization was North America, having 19 multiregional categories this market cycle. By comparison, Asia had only 11 categories and Europe only 6 categories. Overall, there are roughly the same number of “and” categories as “or” categories, and these differences can be difficult to tease apart, as most committees would likely favor a candidate who could do both regional specializations, regardless of if an “or” were specified in the advertisement.
Desired Discipline
The visualizations in the section below reflect job advertisements globally and provide a selection of comparative perspectives across regional and disciplinary specialization, with some more specific examples focusing on Northeast Asia and the humanities.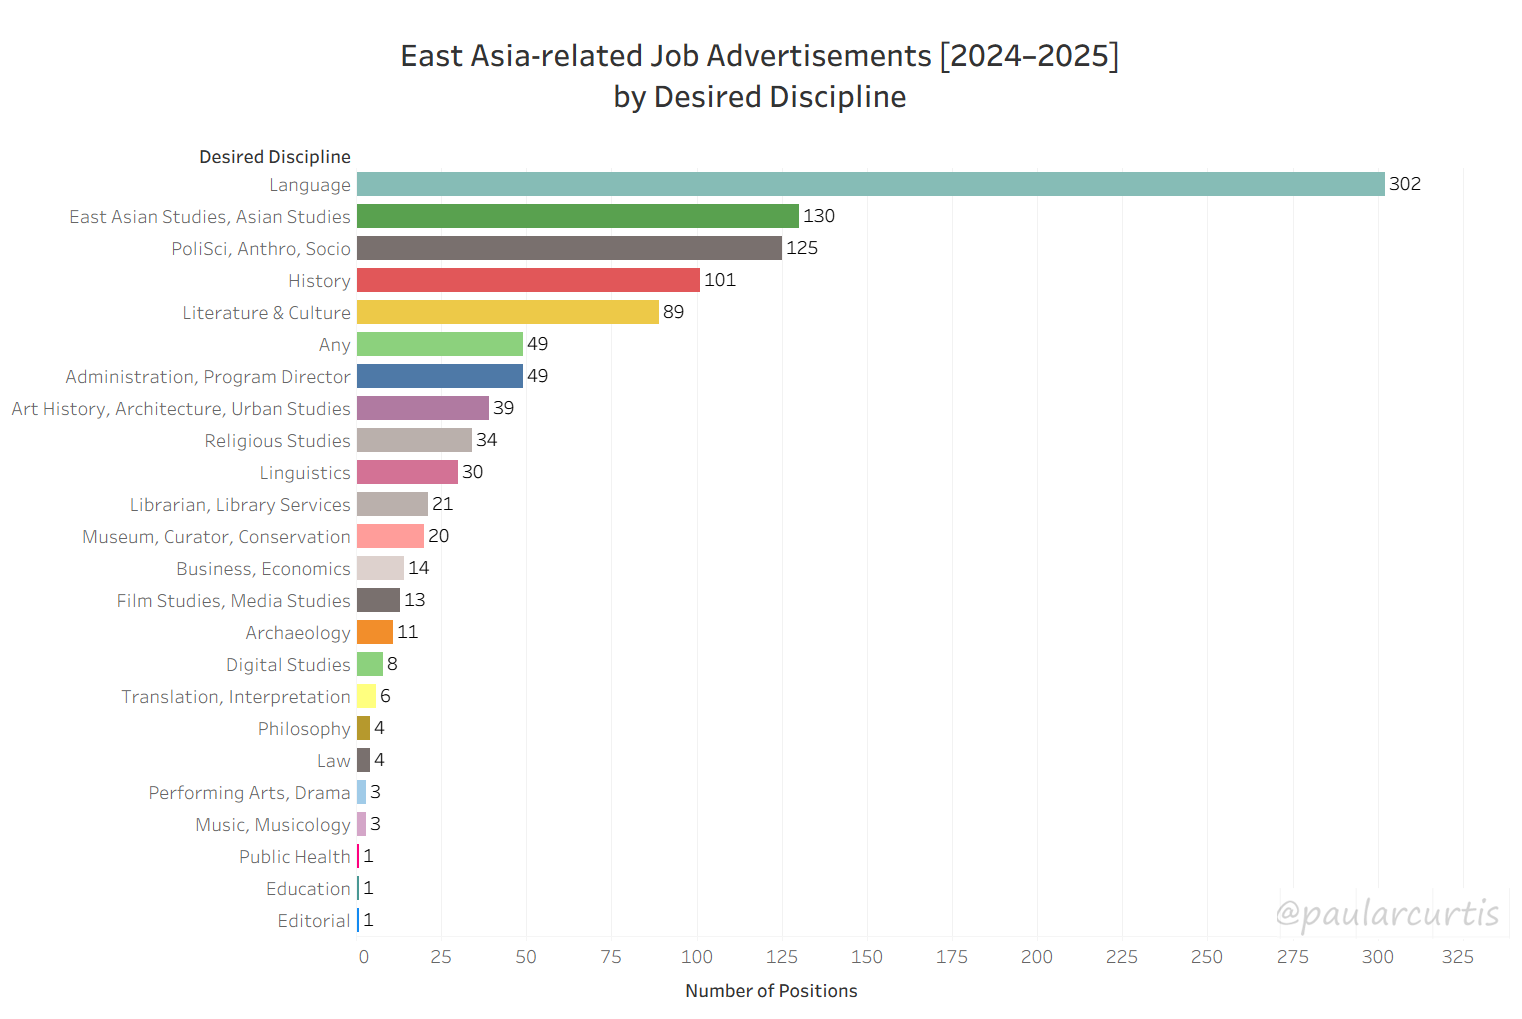
Language was by far the most in demand discipline globally, by a wide margin. It was followed by the generalist humanities category of East Asian Studies and the generalist social science category of Political Science/Anthropology/Sociology, which were roughly equal. These three categories have been the top three disciplines worldwide for the past three years.
Language was by far the most in demand discipline worldwide this year, accounting for 302 ads, or 28.5% of all job advertisements. This was followed by the generalist humanities East Asian Studies category with 130 ads (12.3%) and the combined Political Science/Anthropology/Sociology category with 125 ads (11.8%). History (101 ads, 9.5%) and Literature & Culture (89 ads, 8.4%) occupy the fourth and fifth place roles respectively. With the exception of the 2022–2023 market cycle, in which the social sciences category briefly overtook the humanities, these disciplinary categories have remained in the same top three slots for the last five years. Language has ranged between roughly 21% and 29% of all disciplinary positions globally for the last five years, with this year marking its peak. If we were to roughly divide our categories into conventional “humanities”-oriented disciplines2 and “social sciences”-oriented disciplines,3 the humanities roles combined far exceed that of the social sciences, with 447 ads (42.4% of relevant ads) compared to 162 ads (15.3% of relevant ads). And yet, upon a disciplinary breakdown, the PoliSci/Anthro/Socio category outpaces other non-Language disciplines as a single (if combinatory) category, roughly matching with the generalist category of East Asian Studies.
Desired Discipline by Continental Region
Within Asia, after Language (199 ads), the greatest number of job advertisements was in Literature & Culture (73 ads), followed closely by East Asian Studies (65 ads), and History (56 ads). The PoliSci/Anthro/Socio category was only 35 ads, taking a steep dive from last year, when it was 57 ads vs. History’s 33 ads. Note there is a heavy skew in Language ads in Asia is towards Japan- and China-based positions (most ads I am able to locate in China are the Language ads posted in English, Japanese, or Korean). In North America, the Language category was much closer in total to the other disciplinary categories, having 81 ads, and followed by the social sciences PoliSci/Anthro/Socio category with 65 ads. The next highest discipline, East Asian Studies, had 38 ads, with History (32 ads) and the Any category (31 ads) behind that. For the past two years the top three categories were the same, though History was tied with East Asian Studies and took a dip this year. For Europe, the East Asian Studies generalist category was most prolific, with 27 ads, and here we saw Language in second place with 22 ads. This was followed by PoliSci/Anthro/Socio (18 ads) and then History and Administration advertisements with 11 ads each. In the previous year, Language was in third place after the East Asian Studies and PoliSci/Anthro/Socio categories; Language has risen slowly in number for the last four years. In Oceania, the largest number of positions (5 ads) were for PoliSci/Anthro/Socio, followed by History (2 ads) and Film Studies/Media Studies (1 ad). Last year there were 2 ads each in the East Asian Studies and PoliSci/Anthro/Socio categories and 1 ad each in Language, History, Admin, and Linguistics. The two ads in Africa this cycle were for PoliSci/Anthro/Socio, though last year and the year before there was 1 for that category and 1 for Language. There were no ads I could locate for South America this year, though last year there was 1 ad each in PoliSci/Anthro/Socio, History, and Literature & Culture.Desired Discipline by Regional Expertise
Turning to disciplinary demand at a global level by the desired regional expertise, language instruction (addressed in detail in another section below) was the highest demand across all desired regions of China, Japan, and Korea. This trend is consistent for the past four years for Language instruction in Japanese and Korean, though last year PoliSci/Anthro/Socio was slightly higher for China specializations than Language, breaking this pattern.For jobs seeking a China specialization, Language was the most in demand discipline, with 60 ads (20.9% of jobs for China specialists). The top three disciplines after Language were Political Science/Anthropology/Sociology (48 ads, 16.7%), East Asian Studies (40 ads, 13.9%), and then History (36 ads, 12.5%). During last year’s cycle, the PoliSci/Anthro/Socio category exceeded Language, with 80 ads vs. 62 ads. In 2022–2023, Language (67 ads) and PoliSci/Anthro/Socio (60 ads) were almost equal. After Language, it is fairly typical for this combined social sciences category to be at the top for Chinese Studies, particularly in locations outside of Asia, though the breakdown was not terribly different between Asia and North America this year. Within Asia, Language was the most in demand for China specialists, though its numbers were comparatively low (27 ads) and the East Asian Studies (20 ads), Literature & Culture (18 ads), and History (18 ads) were fairly close to one another, with PoliSci/Anthro/Socio trailing behind (12 ads). For North America, Chinese Language was top (26 ads), followed by PoliSci/Anthro/Socio (21 ads), and a sharper difference with East Asian Studies (13 ads) and History (11 ads). For Europe, however, PoliSci/Anthro/Socio (13 ads) was about twice as much as Language and East Asian Studies (7 each) and History (6). Of all China specialist positions globally this year, 125 ads (43.6%) were tenure track, 136 ads (47.4%) were contingent (95 non-TT, 41 postdocs), and 26 ads (9%) were N/A. If we were to discount Language positions that skew the data somewhat towards contingency, 49.3% were TT and 39.2% were contingent. This year's 43.6% tenure track job ads for China specialists is a slight decline from the previous market cycle, in which 45.8% of ads were tenure track, though the percentage has fluctuated over the last five years between 33% and 45%.
For jobs seeking a Japan specialist, Language was the highest disciplinary category by far, with 202 ads, or 41.8% of all Japan-focused posts (a total of 483 ads). In second and third at nearly equal numbers were Literature & Culture (55 ads, 11.4%) and East Asian Studies (52 ads, 10.8%). For these to be in the top three and on par with one another is not surprising, given the humanities focus of most Japan-related positions. History was fourth with 40 ads (8.3%), and the social sciences category of PoliSci/Anthro/Socio was half that, with 20 ads, tied in number with Linguistics. If we were to remove jobs based in Japan that heavily bias these results, we would still have 81 ads for Language, far exceeding East Asian Studies, which would have 29 ads, but the social sciences would then be in third with 14 ads. Literature & Culture, however, would take a dive to only 5 ads, showing us the strength of Japanese literature-specific advertisements in Japan itself (not unlike one might find English advertisements in the Anglophone world). The top six categories (Language, Literature & Culture, East Asian Studies, PoliSci/Anthro/Socio, History, and Linguistics) remain the same across the last five academic job market cycles. Language, Lit & Culture, and East Asian Studies are consistently the top three across all five years, though East Asian Studies and Lit & Culture (which have significant overlap) occasionally swap places. The same can be said for the latter three discipline categories. Of Japan specialist positions globally, 187 ads (38.7%) were tenure track or roughly TT-equivalent, 225 ads (46.6%) were non-TT, 35 ads (7.2%) were postdocs, and 36 ads (7.5%) were N/A. If we were to discount Language positions, which skew the data somewhat towards contingency, then 47.7% ads were for TT roles and 35.9% were contingent. However, if we were to remove jobs based in Japan (on top of Language), then TT roles would drop to 26.2% and contingent roles to 58.2%, suggesting the relatively small number of permanent positions outside of Japan. Compared to last year, this is a decline, as 38% of non-Language, non-Japan-based ads were for Japan specialists, with roughly the same percent in the 2022–2023 cycle, and 43.2% in the 2021–2022 cycle. The overall percentage of permanent Japan-related jobs can therefore be said to be in decline.
In Korean Studies, which has been historically underrepresented among East Asian Studies hires and institutional support, there were 109 ads total in the 2024–2025 market cycle, a decline from last year’s 136 ads despite an overall climb in the previous four years (from 63 ads to 92 ads, then 119 ads and finally 136 ads). We can thus see the impact of hiring freezes at a critical moment of growth for Korean Studies. For Korean Studies, too, Language was the dominant disciplinary category, having 40 ads (36.7% of all Korea-focused ads). This was followed by the generalist East Asian Studies category with 20 ads (18.3%), and then the Any category with 8 ads (7.3%). The Any category is not surprising here, as postdocs (particularly the recent Korea Foundation postdocs) have enhanced this category. After Any is Literature & Culture with 7 ads (6.4%) and PoliSci/Anthro/Socio (6 ads), which tied with the Administrator category. Both Language and East Asian Studies have consistently been the top two disciplinary categories for Korean Studies for the last five years. Though their numbers have varied, the Any category and the social sciences group category have more or less traded for the next highest positions over the previous several years. The influence of Korean popular media is likely responsible for the strength of the EAS generalist role. Of the positions in Korean Studies offered globally, 37 ads (33.9%) were tenure track, 53 ads (48.6%) were non-TT, (9.2%) 10 ads were postdocs, and 9 ads (8.3%) were N/A. This means that 57.8% were contingent. If Language ads were removed, 46.4% would be TT and 40.6% would be contingent. Despite the slight decline in the number of jobs available with a Korea focus this year, the overall percentage of permanent to contingent roles is nearly equal with the previous market cycle, and the past two years mark an uptick in TT or TT-equivalent positions compared with the two market cycles prior to those. One wonders if Korean Studies would have experienced further growth this year, had the entire field not been struck by funding freezes and cuts. Comparing all three regions, on the whole Chinese Studies had the highest percentage of tenure track or TT-equivalent ads compared to its contingent ads, with 43.6%. Japanese Studies followed, with 38.7% TT, and Korean Studies was not far behind with 33.9% TT. Keep in mind, however, that the number of ads therein varies significantly (125 ads for China, 187 ads for Japan, and 37 ads for Korea). If we were to remove all jobs located in Japan, the relative number of permanent positions would also change significantly, with 34.5% TT for China, 30.5% for Korea, and only 15.8% for Japan, speaking to the weakness of permanent roles for Japan specialists outside of Japan and the deep bias of the Asia-based data. Of the 296 TT/TT-equivalent positions in Asia, 161 ads (~54%) were for Japan, 86 ads (~29%) were for China, and 18 ads (~6%) were for Korea. In North America, of the 110 TT/TT-equivalent ads, 30 ads (~27%) were for China, 21 ads (~19%) were for Japan, and 19 ads (~17%) were for Korea. In Europe, of the 16 TT/TT-equivalent ads, 9 ads were for China, 4 ads were for Japan, and there were no ads for Korea.
Discipline: History
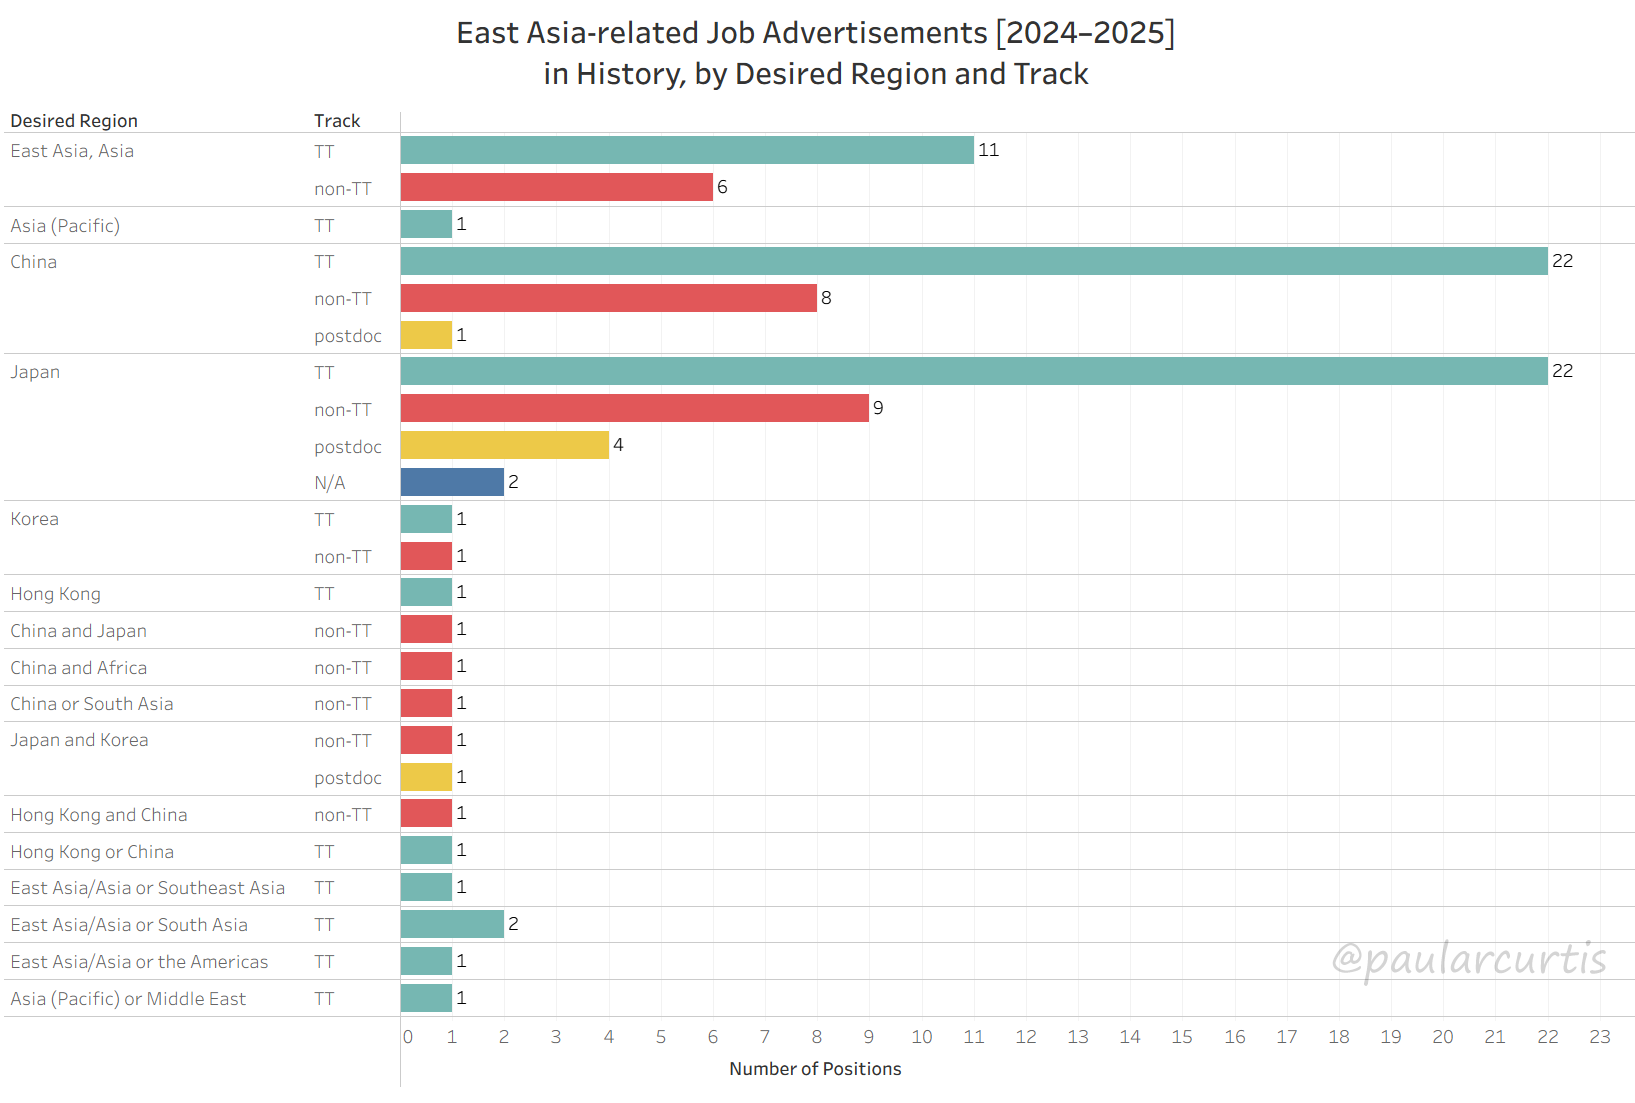
There was a roughly 7% decrease in the number of History job announcements worldwide. In North America, the number fell by 56%, while in Asia it rose by 70%, and in Europe remained roughly the same. The majority of job ads globally were for Japanese history (by a small margin), but outside of institutions in Japan, the majority of job ads were for Chinese history (by a wide margin). There were only 2 ads explicitly for Korean history as the main specialization. Premodern ads accounted for 1/5th of positions globally (and only 9% in locations outside of Japan).
Globally, there were 101 job advertisements in the field of History for the 2024–2025 cycle. There were slight increases in the total of job postings in History for the last three years, although the highest in the last five cycles was 113 ads in 2021–2022. We are only just beginning to see a return to that height. However, viewed by continental region, the multiyear change is somewhat different. Asia, notably with jobs based in Japan as the core source of data, has seen (uneven) growth, with a rise in History positions this year to 56 ads from 33 ads last year, 31 ads in 2022–2023, 47 ads in 2021–2022, and 29 ads in 2020–2021. North America, too, has been uneven, but is now showing a decrease. Beginning in 2020–2021 there were 21 ads, followed by a bump in 2021–2022 to 51 ads, which fell the next year to 37 ads, then rose to 50 ads in 2023–2024, and this year fell again to only 32 ads. Europe, having fewer ads overall, has seen less dramatic changes in its fluctuating numbers. History job ads in Europe began in 2020–2021 with 10 ads, going up to 13 ads in 2021–2022, falling to 10 ads the next year, then 9 ads last year, and slight rise to 11 ads this year. North America therefore shows the most significant decline in the East Asia-related History field during the 2024–2025 market cycle. The majority of global positions this year were advertised for Japan specialists (37 ads, or 36.6% of History advertisements), followed closely by China (31 ads, 30.7%). Generalist East Asia/Asia specialists who can cover the entire region were in third with roughly half the number of Japan/China (17 ads, 16.8%), while there were only 2 advertisements for Korean history, tying with ads seeking Japan AND Korea coverage and for ads seeking East Asia/Asia or South Asia. If the jobs based in Japan were removed, China would far outpace Japan, with 23 ads vs. 6 ads, while East Asia/Asia would only drop to 13 ads and Korea would remain the same. In the previous 2023–2024 cycle, China and East Asia/Asia were nearly tied with one another, having 29 ads and 28 ads respectively, while Japan had only 19 ads, and Korea 3 ads. In this cycle, too, if jobs based in Japan were removed, Japanese history positions would sink to only 6 advertisements, whereas China and East Asia generalist positions would remain roughly the same.
History Jobs by Track
If we look at all jobs in History by their track, of the 101 advertisements globally, 64 ads (63.4%) were for tenure track/TT-equivalent posts. There were 35 ads for contingent positions (34.6%; 29 non-TT, 6 postdocs), and 2 N/A ads. The percentage of TT jobs has risen slightly over the last five years, from 55.6% of the History job ads in 2020–2021 to 63.4% this year, but the actual number of jobs has not risen significantly. At a glance the 63.4% may also seem like a fairly promising ratio of relatively secure to relatively insecure jobs, the difference between continental regions is again significant, given the overall fewer number of jobs in say, North America and Europe. While Asia had 40 TT/TT-equivalent jobs in History this year (more than twice the number last year), North America had 19 ads (a decline from 31 TT ads last year), Europe had 4 ads (an increase of one ad from last year), and Oceania 1 ad (zero last year).History Jobs by Desired Region
For jobs in Chinese history (including positions that have China AND/OR something else), 23 ads of the 36 total globally (64%) were for TT/TT-equivalent positions. 12 ads were for non-TT roles (33%) and 1 ad was for a postdoc (3%). This is a decline from last year, when the percentages were 75-19-6. The United States offered the most jobs in Chinese history (11 ads), followed by Japan (8 ads), and Hong Kong (5 ads). Positions were offered in the US, Japan, Hong Kong, China, the United Kingdom, Taiwan, France, and Australia. Both the US and Japan had 7 TT advertisements, while Hong Kong had 4 TT ads, China 2 ads, and 1 each in the UK, Taiwan, and France. For Japanese history jobs, 22 of the 40 total ads (55%) were for TT/TT-equivalent roles. 11 ads were for non-TT roles (28%), 5 ads were for postdocs (13%), and 1 ad was N/A (5%). This is a slight shift from last year, which had 50% TT ads, but 18% non-TT and a larger 23% postdocs. The vast majority of jobs in Japanese history are based in Japan, with 31 of the 40 ads (78%) there. The United States, meanwhile, had only 5 ads in Japanese history. France had 3 ads, and Canada had 1 ad. Of the ads based in Japan, 20 were for TT roles, whereas the United States had only 1 tenure track position in Japanese history, as did Canada. Only these four countries offered positions in Japanese history. For Korean history jobs, there were only 4 advertisements globally, and only 2 ads were for primarily Korean specialization, the remaining 2 ads requesting expertise in both Korean and Japanese history. In the United States, there were 3 advertisements (2 non-TT, 1 postdoc), and in South Korea there was 1 ad (TT). It is likely that in within Asia, particularly South Korea or China, there are more ads that are difficult for me to locate, but even comparing among those ads it is possible for me to include easily, this is a stark difference from China and Japan. Last year there were 5 advertisements (3 ads in the US, 1 in Israel, and 1 in Sweden), and the two cycles before that, 4 advertisements each for Korean history. In addition to these country-specific advertisements, there were 23 ads globally for some combination of East Asia/Asia or Asia (Pacific) by itself or the AND/OR another region. Notably, 17 of these ads were for TT positions. The majority of the advertisements (14 ads) were based in the United States, reflecting the growing trend of departments hiring people who can cover entire regions, rather than focusing on a single country. This pattern is consistent across the last five years.History Jobs by Time Period
Considered by time period, of the 101 ads in History, 44 ads (43.6%) were for any time period (no preference), 36 ads (35.6%) were for modern, and 21 ads (20.8%) were for premodern. The exact ratios have varied over the last four years, but at a global level the “any” period category tends to stay in the 38% to 46% range, with modern ads between 32% and 36%, and premodern 20% to 21%. Similar to the desire for regional breadth, in North America we find 21 of the 32 ads are for any period, with only 8 ads focused on modern and 3 ads for premodern history. Contrast this with Asia, where we find 20 ads for any, 19 ads for modern, and 17 ads for premodern, a much more even spread. Jobs based in Japan, particularly those for Japanese Studies, tend to favor the premodern more than in other locations. If Japan-based jobs were removed from our data, the global percentage of premodern jobs in History would drop from 21% to only 9%. In Europe, only 2 ads are for any period, 8 ads are for modern, and 1 ad is for premodern. In Oceania there is 1 ad each for any and modern. Premodern positions were the fewest in number for both TT and non-TT categories globally, and there were no postdocs in premodern history. For Chinese history, 17 ads were modern, 14 ads were any period, and 5 ads were premodern. Last year there were 13 ads for modern, 9 ads for any period, and 10 ads for premodern. For Japanese history, there were 14 ads for modern, 13 ads for any period, and 13 ads for premodern. While this looks like relative parity across the time periods, the location bias is a factor—all premodern history positions were based in Japan this year. For Korean history, 3 of the 4 ads were for any period and were all based in the United States and the 1 ad for premodern Korean history was based in South Korea. Most ads looking for East Asia/Asia or Asia (Pacific) with variations on broad regional focus were for any period (17 ads), with only 4 ads for modern and 2 ads for premodern.Disciplines: East Asian Studies and Literature & Culture
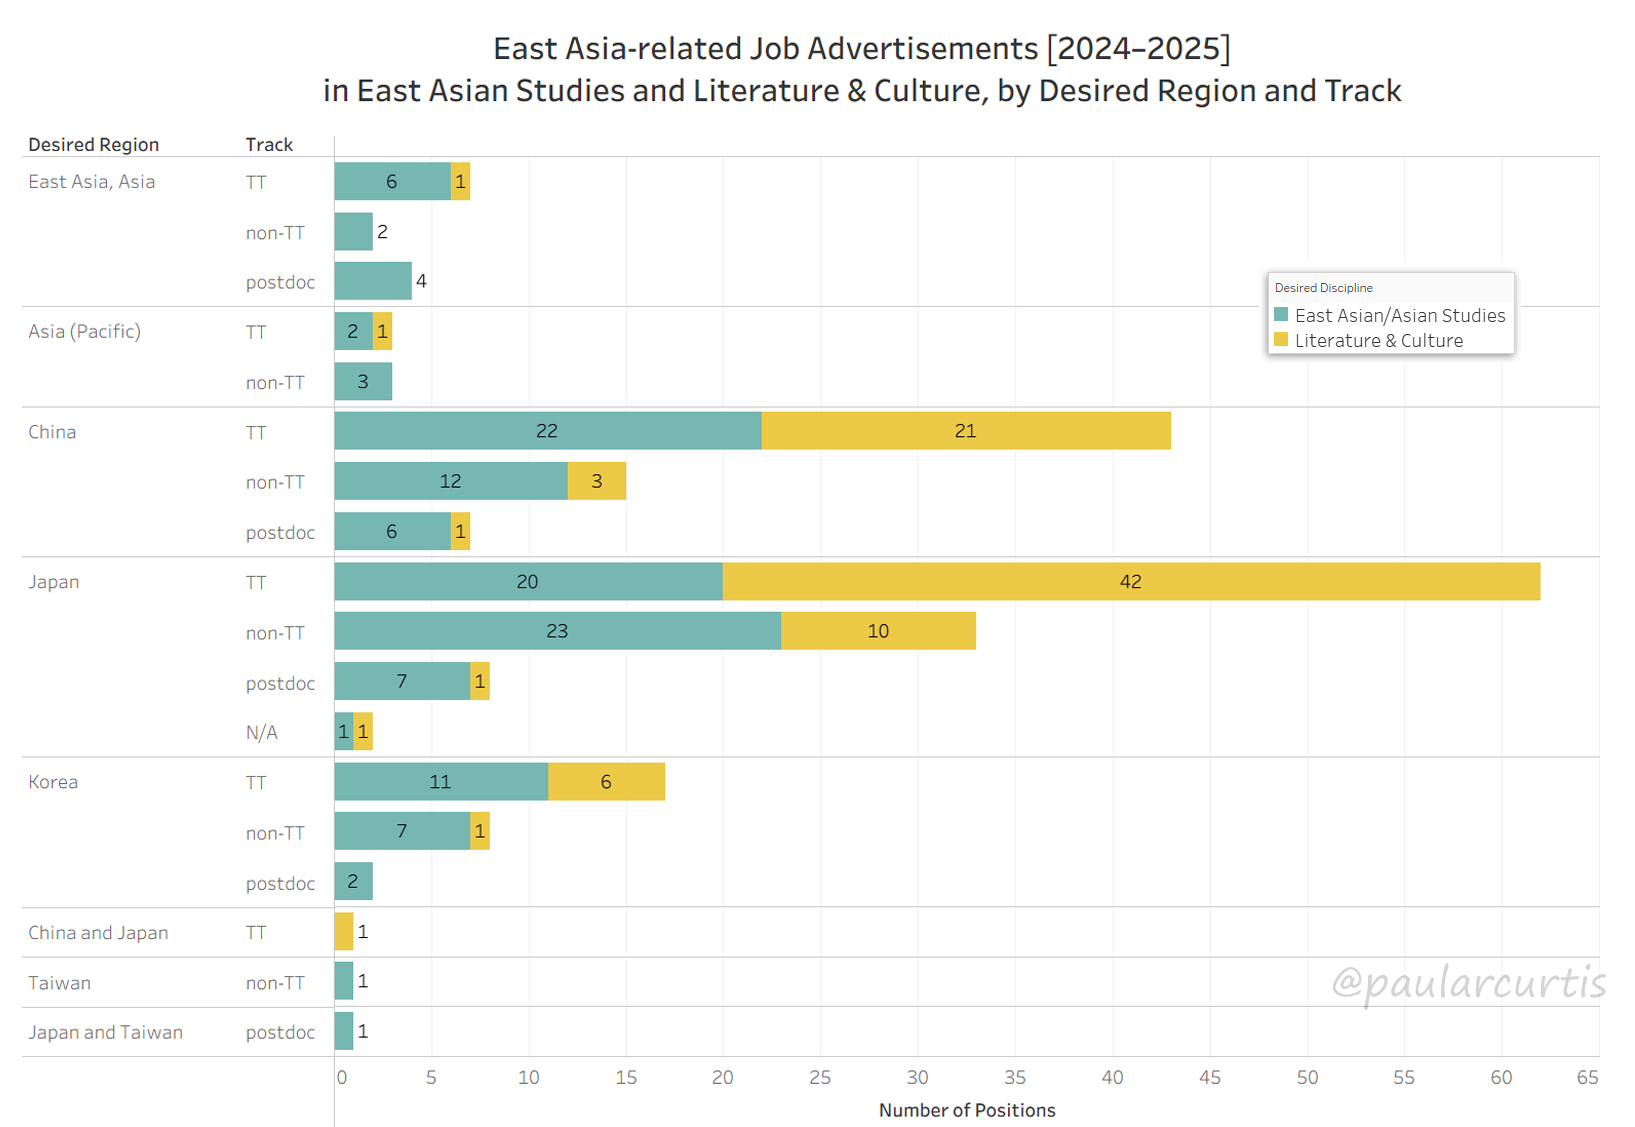
The ratio of East Asian Studies to Literature & Culture ads was roughly 60/40. Globally, the demand for Japan specialization was highest in both categories. Japan-focused ads were highest in these combined categories in Asia and Europe, but China ads were highest in North America. Korea specialization represented 12% of the combined ads. Ads asking for "any period" (either or both) were more than half of all job ads in this combined category.
The above visualization combines (though visually distinguishes) both generalist East Asian/Asian Studies positions and Literature & Culture positions, as these categories frequently overlap in job advertisements that list a variety of fields such as literature, cultural studies, visual arts, media studies, etc. I have combined them in the visualization because popular culture/cultural studies positions, particularly literature, are often combined with one another while being contrasted with other more strictly delineated disciplines (e.g. History) as well as looked to as a measure of interest in the study of a specific region. This year featured a total of 219 ads (20.7% of the global total) in these combined categories, with East Asian Studies comprising 130 ads (59.4% of the combined total) and Literature & Culture comprising 89 ads (40.6%). The global total of East Asian Studies job ads dropped from 167 ads last year to 130 ads this year, while Literature & Culture only dropped from 96 ads to 89 ads. The disparity between the two categories, with Literature & Culture being roughly one half to two thirds the size of East Asian Studies, is consistent across the last five years. In Asia, the ads in Literature & Culture were slightly more than East Asian Studies, having 73 ads compared to 65 ads. In North America, East Asian Studies was markedly higher, with 38 ads vs. 14 ads. In Europe, the difference was greater still, with 27 ads in East Asian Studies vs. 2 ads in Literature & Culture. Given the ubiquity of East Asian Studies as a catch-all category for humanistic disciplines related to East Asia/Asia outside of Asia itself, we should perhaps not be too surprised at this disparity, but it is worth noting anyway.
EAS and Lit & Culture Jobs by Desired Region
Demand for Japan specialization was highest in the combined EAS/Lit category as well as across both individual disciplines. In the combined totals Japan accounted for 105 ads (47.9% of the total), China for 65 ads (29.7%), Korea for 27 ads (12.3%), East Asia/Asia for 13 ads (5.9%), Asia (Pacific) for 6 ads (2.7%), and a smattering of 1 ad each for Taiwan, Japan AND Taiwan, and China AND Japan. The last four years show roughly the same global trend of Japan in the lead with China specialization at about 2/3rds that number. Neither Japan nor China specialization in this combined humanistic category has had consistent increases or decreases in the total number of advertisements. Korea, after a comparative strong showing in 2020–2021 with 26 advertisements, dropped to 16 ads the following year and inched upward to reach 27 ads this year. Taking into account continental region, demand for Japan specialization was highest in Asia and Europe but not in North America. Within Asia, Japan specialization was 74 ads (53.6%), followed by China with 37 ads (26.8%), Korea with 15 ads (10.9%), and East Asia/Asia with 6 ads (4.3%). In Europe, Japan was 17 ads (58.6%), China 7 ads (24.1%), Korea 3 ads (10.3%), and East Asia/Asia with 1 ad (3.4%). In North America, China was in the lead with 21 ads (40.4%), followed by Japan with 14 ads (26.9%), Korea with 9 ads (17.3%), and East Asia/Asia with 6 ads (11.5%). In the previous two job market years, Japan had a higher number of these combined jobs in North America, meaning this year is a reversal of those trends. East Asian Studies If we look at each disciplinary category individually beginning with East Asian/Asian Studies, Japan would still lead with 51 ads of the 130 global total (39.2%), China following closely at 40 ads (30.8%). Korea has 20 ads (15.4%), and the East Asia/Asia general region has only 12 ads (9.2%). These percentages are roughly in keeping with the last four years of advertisements. Broken down into continental regions, in Asia Japan was the highest number of ads (24 ads), but was fairly close to China (20 ads). Korea was in third (11 ads) and then East Asia/Asia (4 ads). Europe also had more Japan ads than any other desired region (15 ads), but the gap between Japan and China was greater, with only 7 ads for China. There were 3 ads for Korea and only 1 ad for an East Asia generalist. North America was the only location where Japan did not come out on top for the East Asian Studies category, having 12 ads for Japan and 13 ads for China. Both Korea and East Asia/Asia had 6 ads each. Although last market cycle Japan specialization was first in East Asian/Asian Studies hires across all three continental regions, China was close to Japan in numbers. Literature & Culture For the 89 advertisements that were explicitly for Literature & Culture, the numbers look quite different. Of the 89 total ads in Lit & Culture, 54 ads (60.7%) were for Japan, versus only 25 ads (28%) for China, and 7 ads for Korea (7.9%). In our continental breakdown for East Asian Studies, Asia had more parity between regional specialization; however, for Lit & Culture there is a significant gap, with 50 ads for Japan and 17 ads for China. This is not particularly surprising given our data bias, and notably 5 of those China ads are based in China and Hong Kong. In Europe, both of the Literature & Culture positions advertised were for Japan. In North America, China had a larger number of advertisements for Literature & Culture (8 ads), and even Korea (3 ads) was higher than Japan (2 ads). The sharp decline in Japan-focused Lit & Culture hires in North America is notable, as last year there were 13 ads for Japan, 10 ads for China, and 2 ads for Korea. In the three years prior to that they had also been somewhat closer in numbers. So while on a global level the demand for a focus in these humanistic categories of East Asian Studies and Literature & Culture is highest in Asia and Europe, in North America right now we find Chinese Studies on the rise and a decent showing in Korean Studies.EAS and Lit & Culture Jobs by Track
If we consider these combined categories by track, 133 ads (60.7%) of the total 219 ads were tenure track or TT-equivalent, whereas 84 ads (30.3%; 22 postdoc, 62 non-TT) were contingent. 2 ads (0.9%) were N/A. Within Asia, 101 ads of the 138 ads total (73.2%) were TT, 28 ads (20.3%) were non-TT, and 2 ads (1.4%) were N/A. Last year 70.7% were TT, so this year is a slight improvement. In North America, 29 ads of the 52 ads total (55.8%) were tenure track, 17 ads (32.7%) were non-TT, and 6 ads (11.5%) were postdocs. Last year 57.7% of North American ads in these combined categories were TT, so this is a slight decline. In Europe, of the 29 ads only 3 ads were permanent roles, 17 ads were non-TT, and 9 ads were postdocs. Considering just the raw number of advertisements, Asia has seen a considerable leap in the number of relatively secure positions in last two years, doubling in the number TT/TT-equivalent positions from 2022–2023 and maintaining about the same number this year. North America saw a curve from post-COVID recovery, nearly doubling in number by 2022–2023, but dropping back down in the last two years. Europe saw a dramatic decline, having numbers that went from 14 permanent position ads in 2020–2021 to 17 ads, then 12 ads in 2022–2023, 14 ads last year, and only 3 ads this year. Note that Oceania had no permanent roles advertised this year. In East Asian Studies specifically, of the 65 total ads there were 40 ads (61.5%) that were TT/TT- equivalent, 18 ads (27.7%) that were non-TT, 6 postdocs (9.2%), and 1 N/A ad. For North America, 18 ads of 38 total (47.4%) were TT, 14 ads (36.8%) were non-TT, and 6 ads (15.8%) were postdocs. For Europe, there were 3 TT ads out of 27 ads total (11.1%). There were 16 ads that were non-TT (59.3%) and 8 ads that were postdocs (29.6%). For Literature & Culture, the overall percentages are less meaningful, given how few advertisements there were. But note that in Asia (largely Japan), 61 ads out of 73 ads in Lit & Culture were for TT/TT-equivalent positions. There were 10 ads that were non-TT, 1 postdoc, and 1 N/A. In North America, 11 ads out of 14 in Lit & Culture were for TT jobs and 3 ads were for non-TT. In Europe, there were no permanent positions advertised in Lit & Culture, but there was 1 non-TT and 1 postdoc. Oceania has had no Literature & Culture positions advertised in the last five years. In terms of raw numbers, the same trends for TT/TT-equivalent job ads for East Asian Studies over the last five years are also true for Literature & Culture. Relative to East Asia Studies there is a better percentage of permanent positions to non-permanent ones in Literature & Culture (at least in Asia and North America), but the overall number of ads is much lower. Nevertheless, it’s worth noting that most East Asian Studies generalist jobs tend to lean towards a literature specialist with diverse training.EAS and Lit & Culture Jobs by Time Period
In terms of time period, the “any period” category was roughly double that of the others, with 115 ads (52.5%) of the total 219 ads. By comparison, there were 55 ads for modern (25.1%) and 46 ads for premodern (21%). There were 3 ads for N/A. The any period category was highest in Asia, North America, and Europe, by a relatively significant amount. This suggests such ads were either open to any period or wanted coverage of both premodern and modern. Within Asia, 63 ads (%) were for any, 39 ads (%) were for modern, 34 ads (%) were for premodern, and 2 ads were for N/A. In North America, there were 32 ads (%) for any period, 11 ads (%) for modern, and 8 ads (%) for premodern. In Europe, it was 20 ads (%) for any period, 5 ads (%) for modern, and 4 ads (%) for premodern. Across all three continents, then, when the categories were combined modern and premodern were roughly equal in number but significantly outstripped by the open period category. The differences between each disciplinary group are more helpful for distinguishing modern and premodern opportunities. Focusing specifically on East Asian Studies, of the 130 ads total, 88 ads (67.7%) were for any period, 29 ads (22.3%) were for modern, and only 10 ads (7.7%) were for premodern. 3 ads were N.A. Within Asia (65 total ads), 44 ads were for any, 15 ads for modern, 4 ads for premodern, and 2 ads for N/A. In North America, 25 ads were for any, 10 ads for modern, 2 ads for premodern, and 1 ad for N/A. In Europe, 19 ads were for any and there were 4 ads each for modern and premodern. We therefore see somewhat similar trends in Asia and North America to have high numbers of open period ads in East Asian Studies compared to all other categories, with modern being 2-3 times (if not more) the number of premodern. Europe is the exception, having somewhat variation, whereas for the past five years the “any period” category has dominated in Asia and North America. For Literature & Culture, however, these trends do not hold. For those jobs explicitly looking for literary studies expertise (89 total), 36 ads (40.4%) were premodern, 27 ads (30.3%) were any period, and 26 ads (29.2%) were modern. Within Asia, 30 ads of the 73 total were for premodern, 24 ads were for modern, and 19 ads were for any period. North America, even with its very small number of advertisements, had 7 ads for any period, 6 ads for premodern, and only 1 ad for modern. Europe had 2 ads, one each for any and modern. Despite the fact that Literature & Culture has a fewer number of job advertisements, this year it seems to skew somewhat more towards premodern studies than modern. This was true for Asia across the last five years, with the gap between modern and premodern ads growing in the last two market cycles, but for North America modern literature has tended to either break even with premodern ads or surpass them until this year. Europe has tended to favor modern.Discipline: Language
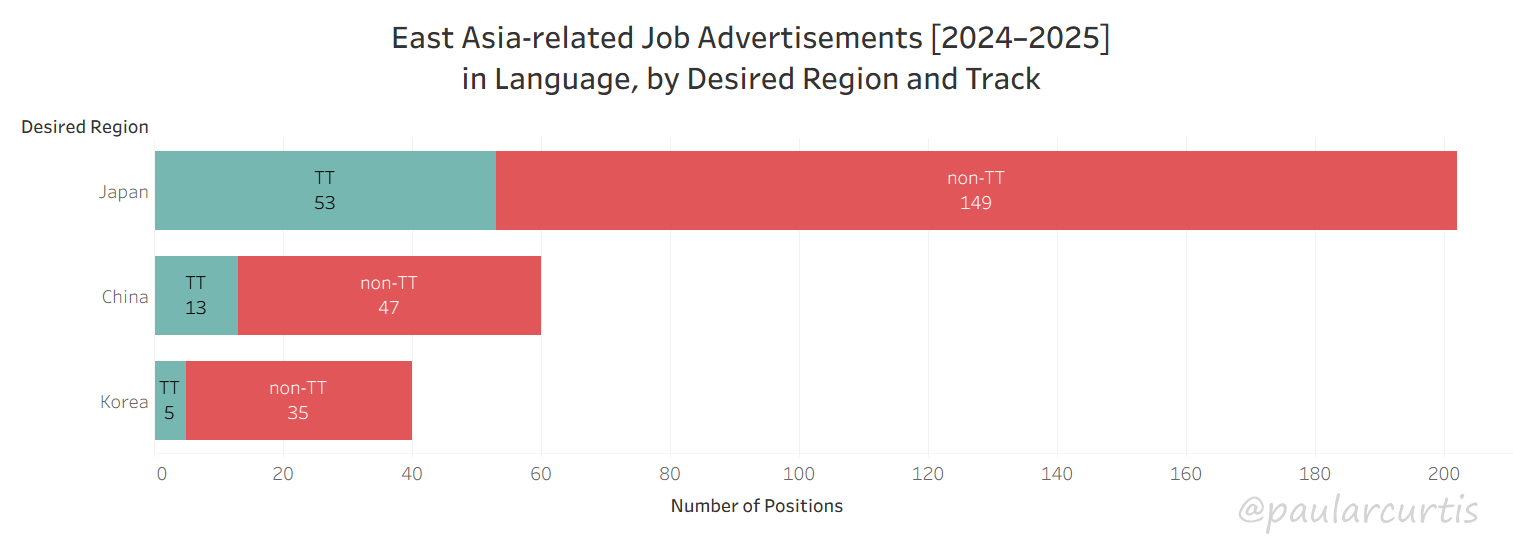
Language has consistently been the field with the greatest number of hires globally for the last five years, and the number of job ads has increased consistently each year. Japanese is the most in-demand language among hires globally, including outside of Japan itself. 66% of Language ads were based in Asia. The total number of Language ads increased in Asia and Europe over the last four years, but declined in North America. 77% of Language positions globally were contingent. North America has the worst contingency rate, roughly 93%.
There were 302 job ads globally specifically for language instructors during the 2024–2025 market cycle, accounting for 28.5% of all jobs globally. Note that these do not include adjuncting roles, only advertisements for job security of one year or more. There has been a steady increase in both the overall number of jobs in Language over the last five years, with 144 ads during the 2020–2021 market cycle, slowly increasing each year from 222 ads to 252 ads, then 292 ads last year and finally 302 ads this year. The overall percentage of Language ads compared to other disciplines also increased steadily over the last five years, from 21.3% to 22%, 24.3%, 24.2% and now 28.5%.
Language Jobs by Desired Region
In keeping with the last five market cycles, Japanese is the most in-demand language, with 202 ads (67% of all Language ads), Chinese having 60 ads (20%), and Korean having 40 ads (13%). If we were to remove the heavy bias of jobs for Japan based in Japan, Japanese would still be the leading hire worldwide, with 81 ads, though it would fall to 54% of the ads, Chinese dropping to 43 ads (29%), and Korean 26 ads (17%). Over the past four years (excepting the COVID market cycle) both Chinese and Korean have remained steadily in the 60-ad and 40-ad range respectively, with little overall change in their raw advertisement numbers. Japanese, however, has consistently increased, jumping from 113 ads in 2021–2022 to 134 ads the following year, then 186 ads last year, and finally 202 ads this year. However, if jobs based in Japan we removed, there would actually be a significant drop between 2022–2023 (116 ads) and 2023–2024 (86 ads), along with a few less this year. In this sense, continental region again makes a notable difference in assessing our annual shifts.Language Jobs by Continental Region
Asia accounted for 199 Language advertisements of the 302 total, or 65.9% of the global Language job ads. Given our aforementioned location bias for jobs advertisements available from Japan, 152 ads out of the 199 total ads were for positions there. 29 ads were based in China, 6 ads in Hong Kong, 3 ads each in South Korea and Taiwan, and 1 ad each in Cambodia, Malaysia, Mongolia, Singapore, Uzbekistan, and Vietnam. With the exception of Singapore, those single advertisements in Southeast, Central, and West Asia are due to a recent outreach program sponsored by the Japan Foundation. Note also the considerable imbalance in the data caused by job search websites based in China that primarily advertise positions for “foreigners” (non-Chinese) in China, most of which are for native Japanese and Korean speakers. Unsurprisingly, jobs in Japanese were the majority of Asia-based advertisements, with 153 ads (76.9%) of the total. This was followed by Chinese with 27 ads (13.6%) and Korean with 19 ads (9.5%). Over the last five years the data was similarly biased, and Japanese has tended to range between 60% to 75% of all Language ads in Asia. Chinese and Korean have fluctuated a little more year to year, tending to both be between 10% and 15% of the total Language ads in Asia. In North America, there were 81 job advertisements, or 26.8% of all global Language ads. The vast majority of these positions were based in the United States, with only one Language ad advertised in Canada this year. The overall number of Language ads in North America has declined steadily for the last four years despite a significant post-COVID rebound. Whereas 2020–2021 featured 74 ads and 2021–2022 leapt to 141 ads in Language, this number fell to 133 ads, then 96 ads last year, and finally 81 ads this year. The most in-demand language was Japanese (35 ads, or 43.2% of North American Language ads), followed by Chinese with 26 ads (32.1%), and Korean with 20 ads (24.7%). Though Japanese still had the largest number of hires, the gap between the CJK languages was not as prominent. That said, Japanese has consistently been the top hiring language in North America for the last five years. Both Japanese and Chinese steadily declined in number over the last four years, whereas Korean has seen an uneven bounce back and forth between +/-5 to 10 job ads each year. In the case of Europe, overall percentages are less meaningful due to the much smaller number of ads, having only 22 ads (7.3% of all Language ads) this market cycle. Japanese had the most hires in Europe as well, with 14 ads as compared to Chinese at half that number (7 ads) and Korean having only 1 advertisement. The overall number of Language ads in Europe has risen in the last four years, though it exhibits an odd difference in annual trends, in that in 2020–2021 there were 28 ads in Language, only to have it sharply drop to 8 ads the next market cycle, with a slow recovery ever since. This might be because of the differing hiring calendars compared to North America and Asia. As for each language, Chinese has fluctuated in the last five years, whereas Japanese has seen growth and Korean a decline. Only 1 position globally was for a premodern language, Japanese, and it was based in Europe. This year there were no Language ads this market cycle that could be located for Oceania, South America, or Africa.Language Jobs by Track
Of the 302 total advertisements in Language worldwide, 71 ads (23.5%) were for tenure-track or tenure-equivalent roles and 231 ads (76.5%) were for non-TT, contingent positions. On a global scale this is a decline in the number of contingent roles over the past four years (from 90.6% contingent in 2021–2022 to 87.7% contingent in 2022–2023, and then 81.8% contingent in 2023–2024. However, we already know that distinction by continental region is fairly important for this disciplinary category. In Asia, 64 ads (32.2%) were TT or TT-equivalent vs. 135 ads (67.8%) non-TT. In North America, only 6 ads (7.4%) were TT while 75 ads (92.6%) were non-TT. In Europe, 1 ad was for a permanent position, while 21 were non-TT. Over the last four years, the rate of contingency in Asia has fallen steadily about 10% each market cycle. North America ranged between 94% and 95% contingent from 2020 to 2023, had an unusual 9% decline in contingent roles in 2023–2024, and now the percentage has climbed back to 92.6%. North America (more specifically, the United States) has consistently had the worst record of reliance on contingent labor in the Language field over the last five years (though it is admittedly difficult to make comparisons with, say, Europe, given its overall smaller number of ads). Considering just the very small number of Language advertisements that offer some measure of job security on the tenure track or with tenure-equivalence, in Asia the majority of those positions were, as one would expect, for Japanese (52 ads), though there were also 9 ads for Chinese and 3 ads for Korean that fell into this category. In Europe there was 1 advertisement for a permanent position in Chinese. Interestingly, in North America there were 3 TT ads for Chinese, 2 TT ads for Korean, and only 1 TT ad for Japanese. Five of those permanent roles in North America were at a government institution. It is worth noting here that I separate out Linguistics and Translation & Interpretation as their own separate categories from the Language category. This is because both Linguistics and Translation & Interpretation tend always to require doctoral degrees as a prerequisite and also tend to offer tenure track positions often unavailable to those whose focus is expected to be language instruction. This year there were 30 ads in Linguistics (2.8% of the global total of ads) and 6 ads in Translation & Interpretation (0.6%). Most of the Linguistics positions were based in Asia (21 ads), followed by North America (8 ads), and Europe (1 ad). Asia and North America each had 3 ads in Translation & Interpretation. Japanese was the highest number in Asia (15 ads), with Chinese and Korean linguistics each with 3 ads. In North America, too, Japanese had the most ads (5 ads), and Chinese, Korean, and East Asia/Asia as a whole each had 1 ad. The one advertisement in Europe was for Chinese linguistics. All of the Translation & Interpretation roles in Asia were for Chinese (3 ads), and North America had a spread of 1 ad each for Japanese and broad regional categories of East Asia/Asia OR the Middle East and East Asia/Asia OR South Asia.Time Period
Jobs with no need for a time period specializations were the majority of hires (38%). Jobs for modernists accounted for 25% of ads globally, while premodern positions were only 9%. Japan and China specialization were roughly equal as the most desirable for modernists, whereas Japan was significantly more in demand for premodern. Removing the location bias of Japan-based institutions, China would be the most in-demand region for both. For the modern, premodern, and any period categories Korea typically had 1/4th to 1/5th the number of available positions and was fourth in demand after Japan, China, and East Asia/Asia generalists. There were only 2 positions worldwide specifically for premodern Korea.
Of the 1,058 job advertisements worldwide this cycle, 409 ads (38.7%), the majority, fell into the N/A category, meaning that specialization in a particular time period was largely irrelevant to the hire. Most of these positions were in Language (301 ads of the 409 total). After Language, Administration/Program Director was the second highest category (45 ads), followed by Linguistics (29 ads) and then Librarian/Library Services (19 ads). The N/A category has consistently been the highest across the last five years, typically ranging from 33% to 39% of all time period categories, with a roughly 10% difference with the next highest category in each year. The "any" period category (meaning time period was relevant to the position, but that specialization in any period would be acceptable OR the hire wanted both modern and premodern capabilities) was second highest, with 287 ads (27.1% of all advertisements). This was close in number to modern, which had 265 ads (25%). The premodern had only 97 ads globally (9.2%). The “any” and “modern” categories often flip-flopped in second and third place over the last five years but stayed relatively close to one another in raw numbers and percentages of the whole (somewhere between 25% and 29% of each year’s ads). Premodern has been less stable, with a total of 42 ads in 2020–2021, jumping to 97 ads the next year, then falling to 73 ads in 2022–2023, back up to 107 ads in 2023–2024, and then this year falling a bit to 97 ads. Premodern ads usually range between 6% and 10% of the global totals each year. If the N/A category were removed from consideration and we only weighed jobs for which time period was relevant against one another, “any” and “modern” would remain fairly high and consistent with one another, accounting for 42% to 47% of global totals each (combined, numbering in the high 80s and 90s), whereas premodern would only make up 9% to 15% of jobs advertised.
Time Period by Continental Region
Breaking down these trends by continental region is particularly helpful, especially knowing the existing biases in our dataset. Among the 565 ads this market cycle based in Asia (heavily based in Japan), the N/A category was highest, with 241 ads (42.7%) of the total. This was followed by “any” with 136 ads (24.1%) and then the modern category with 117 ads (20.7%). There were 71 advertisements for premodern positions (12.6%), which puts it very slightly above the global numbers. If N/A were removed, premodern roles would jump to a striking 21.9%. Asia saw a 5% dip in the percentage of modern positions this past year, whereas premodern stayed steady. For North America, N/A was highest with 132 ads (36.2%), but was not far off from the "any" category (111 ads, 30.4%) and the modern category (104 ads, 28.5%). Well below the global rate of 9.2%, for premodern, there were only 18 ads, 4.9% of all North American advertisements. Even if the N/A category were removed, the percentage of premodern jobs for each year never rises above 8.5%. The raw number of advertisements in these four temporal categories show a bell curve pattern in North America, with the low COVID year numbers recovering into 2022–2023 and then dropping again in the two market cycles that followed (N/A: 99, 204, 216, 169, 132; any: 85, 135, 142, 139, 111; modern: 83, 122, 133, 134, 104; premodern: 13, 23, 24, 25, 18). In Europe the N/A, any, and modern categories were nearly equal with 36 (31.9%), 34 (30.1%), and 35 (31%) ads respectively. There were 8 ads for premodern jobs (7.1%), only slightly below the global percentage. Premodern roles have stayed relatively low over the last five years with the exception of a small bump in 2021–2022, having gone from 10 ads to 18 ads, then back down to 10 ads and 8 ads each for the last two years. Modern, however, has seen a decline, from 56 ads in 2020–2021, a small jump to 64 in 2021–2022, and then back down to 55 ads, then 54 ads, and this year a steep fall to 35 ads. The any category has had a slight uptick in the last three years, but nothing significant, and the N/A category has risen and fallen unevenly. Excluding the N/A category would cause “any” and “modern” to leap to around 45% of jobs each and premodern to a little over 10%. This year about 44% of all modern-focused jobs were located in Asia, with 39% in North America and 13% in Europe. In contrast, Asia hosted 73% of all premodern job advertisements, versus 19% in North America and 8% in Europe.Time Period by Track
If we consider relative job security by the time period desired, the N/A category had 101 TT advertisements (24.7%), 245 non-TT ads (59.9%), and 63 N/A ads (15.4%). The strong presence of non-TT here is not surprising, since many ads that are N/A are those in Language that are more often than not contingent. However, Language and Linguistics comprise the bulk of both the non-TT and TT ads in this category, with most based in Japan (where Language is more likely to fall into a permanent track). In the any period category 130 ads are TT (45.3%), 83 ads are non-TT (28.9%), 61 ads are postdocs (21.3%), and 13 ads are N/A (4.5%). Here the strength of postdocs is due to their openness for any discipline/any period in their advertisements. About twice as many of these TT jobs are based in Asia as compared to North America. For modern, 136 ads (51.3%) were TT, 71 ads (26.8%) were for non-TT, 47 ads (17.7%) were for postdocs, and 11 ads (4.2%) were N/A. Nearly twice as many TT ads for modernists were based in Asia as compared to North America, though the gap was slightly narrower than the any period category. Premodern job had 62 ads (63.9%) TT, 18 ads (18.6%) for non-TT, 10 ads (10.3%) for postdocs, and 7 ads (7.2%) for N/A. At a glance these are, in fact, better percentages of permanent to contingent than the other categories, but keep in mind that the overall numbers are significantly lower. Whereas Asia had about double the number of TT ads compared to North America in the “any” and “modern” categories, for premodern, it is five times as many. There were only 11 ads for TT positions in the premodern across all regional specializations in North America this year.Time Period by Desired Region
Across all four time period categories Japan was the most desired region. However, the strong bias for Japan-based jobs on Japan contributes significantly to that. If we excluded those positions, Japan would still be the top region for the N/A category, but the any period category would be led by East Asia/Asia and China, the modern category would be lead significantly by jobs specializing in China, and the premodern category, too, would be headed by China. Interestingly, if we compare these trends to last year, even with Japan-based jobs included, China still had a much stronger showing, having almost twice as many job ads in modern last year. China Focusing on China as the specialist region (including the AND/OR another region that mentions China), the N/A, any period, and modern categories were roughly equal to one another, with 89 ads for N/A (31%), 86 ads for modern (29%), and 83 ads for any (30%). There were 29 ads for premodern (10%). As mentioned above, last year the percentage of modern China job ads was much higher, at 41%. The majority of modern China ads (37 ads) were based in North America. Asia had 27 ads in modern China, and Europe had 19 ads. In contrast, the majority of premodern China ads (16 ads) were based in Asia, with North America having only 9 premodern ads, and Europe 4 ads. Japan For Japan as a specialization, the greatest number of advertisements was the N/A category, with 246 ads (51%). This is likely due to the larger number of Japanese language positions. The any category and modern category were close to one another, with 92 ads (19%) and 88 ads (18%) respectively. Premodern Japan had 57 ads (12%). If we removed jobs based in Japan, the premodern would plummet to 4%. There were only 7 job advertisements looking for premodern Japan specialization outside of Japan this year. Last year, it was 8 ads. The gap between modern Japan jobs based in Asia (42 ads) and North America (27 ads) was not terribly wide. Europe had 10 ads for modern Japan. However, while there were 50 ads for premodern Japan specialization in Asia, there were only 3 ads for premodern Japan in North America and 4 ads in Europe. Korea In Korea specialization, 54 ads (50%) were for the N/A category (the majority of those, 40 ads, being in Language). Similar to Japan, the any category (30 ads, 28%) and modern category (23 ads, 21%) were relatively close, but there were only 2 advertisements (2%) globally for premodern Korea. These trends are in keeping with last year’s data, and the raw numbers are also relatively similar. Modern-focused jobs were almost equal in Asia (10 ads) and North America (11 ads), with 2 ads in Europe. The premodern jobs were based in South Korea and the United States.Time Period by Discipline
Of the 101 total History jobs globally this market cycle, 44 ads (43.6%) were for any period, followed by 36 ads (35.6%) for modern, and 21 ads (20.8%) for premodern. These percentages are roughly in keeping with last year’s market. Within Asia, of the 56 total ads 20 ads were for any period, 19 ads were for modern, and 17 ads were for premodern, having relative parity across all time period categories. Asia is the only location where premodern history is competitive with other time periods. In North America, of the 32 ads for History, 21 ads were for any period, 8 ads were for modern, and 3 ads were for premodern. The prevalence of “any” suggests either the ad was open to either period or wanted coverage of all periods. In Europe, of the 11 ads total 8 ads were for modern, 2 ads for any period, and 1 ad for premodern, a surprisingly strong showing for modern history. The relatively equal numbers in Asia this year are not typical, as the percentages of each time period category have frequently changed over the last five years. For North America, the any period category has dominated for the last four years, with the gap between “any” and “modern” widening as fewer modern-specific opportunities have been advertised. For Europe, modern history has been the top time period category for the last four years, with 3-4 times the number ads compared to “any” or “premodern.” The vast majority of modern history jobs were for China (15 ads, 17 ads if combined with other regions) and Japan (14 ads). The majority of premodern history jobs were for Japan (13 ads, all based in Japan). There were no modern Korean history jobs advertised. The one premodern Korean history job was based in South Korea. In the combined East Asian Studies and Literature & Culture (generalist humanities) categories, of the 219 ads there were 115 ads (52.2%) for any period, leaving the time period open or comprehensive. There were 55 ads (25.1%) for modern, 46 ads (21%) for premodern, and 3 ads (1.4%) for N/A. These percentages are roughly the same across the last five years. Interestingly, within all three continents with job ads in the combined category, the “any period” was dominant, with modern and premodern being relatively even and 2-3 times fewer in number. In Asia there were 63 ads for any, 39 ads for modern, 34 ads for premodern, and 2 ads for N/A; in North America, there were 32 ads for any, 11 ads for modern, 8 ads for premodern, and 1 ad for N/A; in Europe there were 20 ads for any, 5 ads for modern, and 4 ads for premodern. In the past five years there were some cycles where this trend persisted, but most had a much wider gap between modern and premodern. That said, the differences by East Asian Studies more broadly and Literature & Culture specifically do matter. At a global level, of the 130 ads for East Asian Studies 88 ads (67.7%) were for any, 29 ads (22.3%) were for modern, 10 ads (7.7%) were for premodern, and 3 ads (2.3%) were for N/A. In Literature & Culture, however, of the 89 ads total 36 ads (40.4%) were for premodern, 27 ads (30.3%) were for any period, and 26 ads (29.2%) were for modern. See the EAS/Lit & Culture section above for more on this. Given the data bias, Japan was the most in demand across time periods for the combined category, though it is competitive with China in both disciplinary categories and across time periods when positions based in Japan are removed (with China exceeding Japan in Literature & Culture). For the Political Science/Anthropology/Sociology category (the combined social sciences disciplines category), where premodern is less likely to be in demand, of the 125 total ads, 118 ads were for modern (94.4%) globally, while 7 ads (5.6%) were for any period. These trends are in keeping with the last five years of advertisements, though last year there was a single premodern position (which was in Anthropology). The vast majority of these positions were for Chinese specialists (46 ads, 48 ads with combined regions), while 30 ads were for East Asia/Asia generalist roles (42 ads if counting other combined regions). Those focused explicitly on Japan were only 18 ads (20 ads with combined regions), and Korea 5 ads (6 ads with combined regions). The Religious Studies field also seldom specifies time period, and therefore 88.2% of ads (30 ads) of the 33 ads total were for any period. 8.8% of ads (2 ads) were listed for premodern and 2.9% of ads (1 ad) was for modern. Last year there were no premodern ads in Religious Studies and 84.4% of those listed were for any period. This year in the any period 14 ads for Religious Studies were based in Asia, 10 ads in North America, and 1 in Europe. For modern, 1 ad was in North America, and for premodern 1 ad each of the three ads was based in Asia, Europe, and North America. 5 ads were not tied to a specific region (e.g. postdocs in residence) or time period.School Type
41% of jobs advertised globally were at R1 institutions, which offered roughly twice as many jobs as D/PU (doctoral/professional) universities and 4x as many jobs as SLAC/Bacc four-year institutions. R1 institutions offered about 36% of the global tenure track positions and about 45% of contingent positions worldwide. Every type of school saw a decline in the number of hires this year.
These school type categories should be taken in a general sense, as they do not always map neatly across continental regions. Please see the data category notes at the top of this article for more details. During the 2024–2025 job market season, 437 ads (41.3%) advertised worldwide were located at R1 (very high research) institutions). R1s were the school type with the greatest number of advertisements across the past five years, but we have seen a decline in the percentage they account for on a global level, from 53.5% of job ads in 2020–2021 to 52%, then 51.4%, 45.4% last year, and then 41.3% this year. Although from 2020 to 2023 the D/PU (doctoral/professional) universities, R2, and SLAC/Bacc (small liberal arts colleges or baccalaureate-granting four-year schools) tended to be nearly equal as the next highest locations of job ads, in the past two years the gap has widened between each school type, with D/PU leading, then R2, then SLAC/Bacc. This year there were 228 ads (21.6%) for D/PU, 125 ads (11.8%) for R2, and 103 ads (9.7%) for SLAC/Bacc. R1 institutions tend to provide between 2x and 4x as many job opportunities as the D/PU, SLAC/Bacc, and R2 categories. The majority of R1 institution job ads can be found in North America, whereas the majority of D/PU and R2 job ads can be found in Asia. Four-year institutions were nearly equal in each, and not present in Europe. For Asia, there were 210 ads (37.2%) for D/PU institutions, 143 ads (25.3%) for R1, 69 ads (12.2%) for R2, and 52 ads (9.2%) for SLAC/Bacc. These trends are more or less the same across five years, though in 2022–2023 the R1 and D/PU numbers were roughly equal. For North America, R1s accounted for the vast majority of hires, having 229 ads (62.7%), followed by SLAC/Bacc with 51 ads (14%), then R2 with 30 ads (8.2%), and then government-based positions with 15 ads (4.1%). These trends, particularly the enormous gap between R1 hires and all others, are consistent across the last three years, and in the two market cycles prior government positions were outnumbered slightly by D/PUs. In Europe, R1s also had the most hires, though with a relatively smaller number of job ads the gap was not as severe. R1 had 58 ads (51.3%), followed by R2 with 25 ads (22.1%), then government with 13 ads (11.5%), and independent institutes with 6 ads (5.3%). In Europe the R1 schools have consistently had the most hires, with about 1/2 to 1/3 as many hire in R2s in second place, for the past five years. Other institution types have alternated with a few to half a dozen hires. Of the hires in Oceania this year, 7 ads of the 8 ads total were based in R1s, and 1 ad at an R2, consistent with the last five market cycles. The 2 ads in Africa were both at D/PUs, consistent with the last two market cycles.
School Type by Track
If we consider track by the institution type, we find that R1 institutions accounted for 153 ads of the 429 total TT/TT-equivalent ads globally, or about 35.7%. D/PU institutions had 146 ads (34%), R2 institutions had 60 ads (14%), and SLAC/Bacc institutions had 35 ads (8.2%). For Asia, the highest number of tenure track/TT-equivalent positions were advertised ad D/PU institutions (138 ads), followed by R1 institutions with 71 ads, then R2 with 43 ads and SLAC/Bacc with 23 ads. For the last three years D/PU has overtaken R1s for TT hires in Asia, with the gap widening each year. In North America, R1 schools offered about five times as many TT positions, having 67 ads, while R2 and SLAC/Bacc schools had 13 ads and 12 ads respectively, with 6 ads for government roles and 5 ads for D/PU. Pretty much every school type saw a decline in the number of hires this year, given the funding freezes. In Europe there were 11 ads for R1, 3 ads for R2, and 1 ad each at D/PU and M1 (large schools with Masters programs). R1 schools consistently have three to five times as many hires as other types of institutions in Europe, the numbers for which can vary, but even R1s have seen a steep decline in permanent roles offered in the last five years, going from 42 ads in 2020–2021 to 47 ads, then 31 ads for both 2022–2023 and 2023–2024, and only 11 ads for permanent roles at R1s this year. For non-TT advertisements, R1 institutions also had the largest number of posts, with 158 ads (37.9%) of the 417 ads globally. This was followed by D/PU institutions with 75 ads (18%), SLAC/Bacc with 63 ads (15.1%), and R2 with 52 ads (12.5%). R1 institutions are consistently those with the largest number of contingent hires each year, and the next three highest institution types, SLAC/Bacc, D/PU, and R2 have flip-flopped for the past five years for anywhere from roughly a half to a third of the number of non-TT hires. Within Asia, D/PUs had the most non-TT ads (69 ads), but were followed closely by R1s (50 ads), then roughly equal SLAC/Bacc (28 ads), R2 (24 ads), and government roles (22 ads). For North America, R1s had a much steeper lead with 75 ads, while SLAC/Bacc schools had 35 ads, followed by R2s with 12 ads and M1s with 6 ads. This meant that in North America R1s offered only roughly double the number of non-TT positions as small liberal arts colleges. For Europe, R1s and R2s had the highest number of non-TT positions, with 31 ads and 16 ads respectively. As for postdocs, these tend to be based at R1 institutions that have both the funds and the major institutional centers that can host them, though sometimes there are teaching-centric positions at small colleges. Globally, there were 118 ads for postdocs and 85 of those ads (72%) were based at R1 institutions. R2 institutions accounted for 7 ads (5.9%), and all other institution types (D/PU, SLAC/Bacc, government, museum, institution, non-profit) had a smattering of 3 to 6 advertisements. Within Asia, there were 18 ads at R1 schools, 2 ads each at R2 and D/PU, and 1 ad each at SLAC/Bacc and institutes. For North America, R1s had 55 ads, SLAC/Bacc schools had 2 ads, and R2 and museums had 1 ad each. In Europe, R1 was 10 ads, there were 5 each at institutes and government roles, and 2 each at D/PU and museums. It’s helpful to understand these numbers in terms of contingency percentages broken down in each continental region. For example, at R1 institutions in Asia, TT/TT-equivalent positions are roughly 50% of all job advertisements, while contingent positions (non-TT + postdoc) are 48% of advertisements, a fairly good balance. Note that at D/PUs, which have more hires than R1s in Asia, the percentage of TT job ads is higher, at 66%. However, in North America, at R1 institutions TT ads are only 29% of their job ads, with 57% of ads being contingent (and 14% being N/A). In Europe, only 19% of ads were for permanent roles and 70% were contingent. Within Asia, the percentage of TT jobs at R1 institutions has fluctuated each year but not fallen below 39%, with a peak of 59% last year. Although the percentage of TT jobs at R1s in North America has gone up since 2020 from 19% to 29% over the last five years, and even from 25% last year to this year’s 29%, the overall number of TT jobs fell by 50 advertisements, which is not promising. In Europe, the percentage of permanent roles has fallen steadily for the last four years, from 45% in 2021–2022 to 36%, then 35%, and now 19%, with the raw numbers falling as well. Small liberal arts/four-year colleges are also worth noting. Globally, TT positions comprise 34% of job ads at SLAC/Bacc institutions, with contingent ads being 64%. Within Asia, 44% are TT and 56% are contingent, while in North America only 24% of ads are TT and 73% are contingent. Across the board Asia has better ratios of permanent to contingent rates than North America. Although the TT percentage in North America for SLAC/Bacc schools had gone as high as 44% of ads last year, the dip this year was dramatic, with half as many positions offered and now only 19% TT. Fewer overall jobs and fewer permanent jobs. In Asia the opposite was true, having an 11% increase in TT/TT-equivalent roles and an increase in the number advertised. Globally, of the top hiring school types, R1 institutions and SLAC/Bacc institutions are roughly equal in their poor record of tenure track hires, having 35% and 34% TT ads respectively. That said, given that R1 institutions host a significantly larger number of advertisements, they likely have a worse advertisement to hire record.Public & Private Institutions
This year public institutions hosted over half of all job opportunities (54%). Globally, 43% of public institution job ads were for tenure track roles, vs. 39% for private institutions. Asia's public and private institutions had an equal 52% rate of TT job ads, while North America's public institutions had a rate of 41% TT roles and private institutions merely 22% TT, a gap that widened over the last four years. For Europe, only 14% of ads at public institutions were permanent, and there was only 1 permanent position at private institutions this year.
During the 2024–2025 market cycle public institutions comprised 572 ads (54.1%) of the total 1,058 job advertisements, with private institutions accounting for 472 (44.6%), and another 14 ads in the N/A category. On a global level, the raw number of job ads for each institution type has varied, but by relative percentage there has been a decline in public institutions, from 64.1% in 2020–2021 to 62% in both the following years, then 58.3% last year, and finally 54.1% this year. The ratio of public and private institutions (as well as their level of financial support and size) differs significantly by continental region (and in some cases location), but some broad information and comparisons will still be provided here. For Asia, there were 304 ads (53.8%) for public institutions, 260 ads for private (46%), and 1 ad for N/A (0.2%). Though public has remained more prevalent in Asia over the last five years, the gap between private and public has narrowed, with more private institutions posting ads. In North America, it was the opposite, with more job ads through private institutions than public for the last five years, but the gap was narrower for the last three job market cycles and grew wider this year. For 2024–2025, there were 206 ads for private (56.4%), 156 ads for public (42.7%), and 3 ads (0.8%) for N/A. In Europe, institutions are overwhelmingly public, so with 104 ads (92%) in public, only 4 ads (3.5%) in private, and 5 ads (4.4%) for N/A, the numbers are disparate; this immense difference is consistent across the last five years, all above 92% public institution ads. From a global perspective, 42.7% of public institution job ads were for TT/TT-equivalent positions, while 46.3% were contingent (36.2% non-TT, 10.1% postdoc), and 11% were N/A. For private institutions, TT roles accounted for 39.2%, contingent for 54.9% (44.3% non-TT, 10.6% postdoc), and N/A was 5.9%. Within Asia, public institutions had a higher percentage for TT job ads than the global rate, at 52.6% TT and 40.5% contingent (33.9% non-TT, 6.6% postdoc), and 6.9% N/A. Their private institutions were also higher than global numbers, at 52.3% TT, 46.5% contingent, and 1.2% N/A. Notably, there was no significant difference in percentages of permanent roles between public and private institutions in Asia, and there was greater parity than last year. For North America, the percentage of TT job ads at public institutions was just under the global percentage, having 41% TT and 42.9% contingent (33.3% non-TT, 9.6% postdoc), and 16% N/A. However, the private institutions were much lower, at 22.3% TT job ads, 63.6% contingent (44.2% non-TT, 21.4%), and 12.1% N/A. Private institutions in North America thus offered roughly half the number of tenure track roles as public institutions did. The gap between the two in terms of TT offerings has gradually widened from near equivalence four years prior. In the case of Europe, despite the overwhelming prevalence of public institutions for job advertisements, only 14.4% of those ads were for permanent roles, while 69.2% were contingent (49% non-TT, 20.2% postdoc) and 16.3% were N/A. Private institutions had only 4 jobs ads, one of which was permanent.
Top Hiring Institutions
The following charts show the top 10-15 institutions (globally, and by continental region) that hosted the most hires in East Asian Studies this year. The institution with the greatest number of job ads worldwide was Harvard University (29 ads), followed by Stanford University (18 ads), University of Hong Kong (16 ads), Tohoku University (14 ads), and Chinese University of Hong Kong (13 ads). Hiroshima University and Waseda University each had 12 ads, and Columbia University, Hongkik University, Paris Cité University, and University of Oxford each had 10 ads. The top 11 hiring institutions were thus based in the United States (3 schools), Japan (3 schools), Hong Kong (2 schools), the United Kingdom (1 ad), South Korea (1 ad), and France (1 ad). Of the 11 institutions represented, the top 2 were private, though only 5 total were private. With the exception of Hongkik University, all were R1 very high research institutions.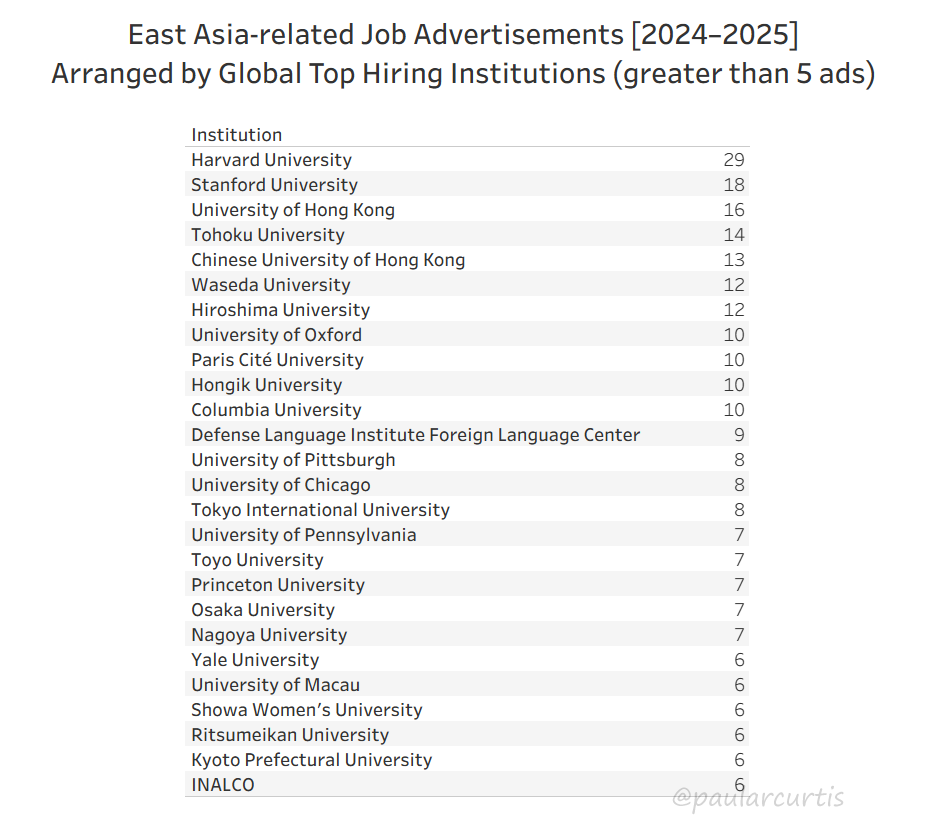
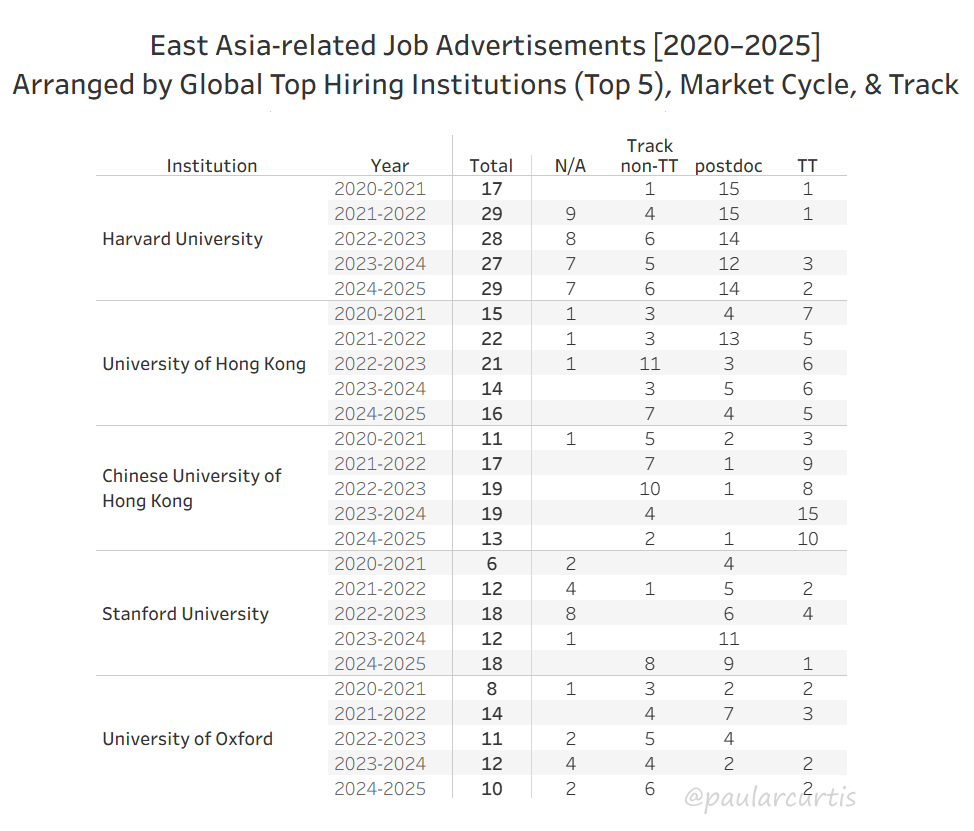
Asia
Looking only at this year's institutions based in Asia, despite the heavy bias of our data towards job ads in Japan, the greatest number of job ads were at the University of Hong Kong. The top ten hiring institutions were the University of Hong Kong (16 ads), Tohoku University (14 ads), Chinese University of Hong Kong (13 ads), Hiroshima University (12 ads), Waseda University (12 ads) Hongik University (10), Tokyo International University (8 ads), Nagoya University (7 ads), Osaka University (7 ads), and Toyo University (7 ads). Six of the ten institutions were public, including the top four. Though the top three institutions were R1, the rest were a mix of D/PU and R2 institutions.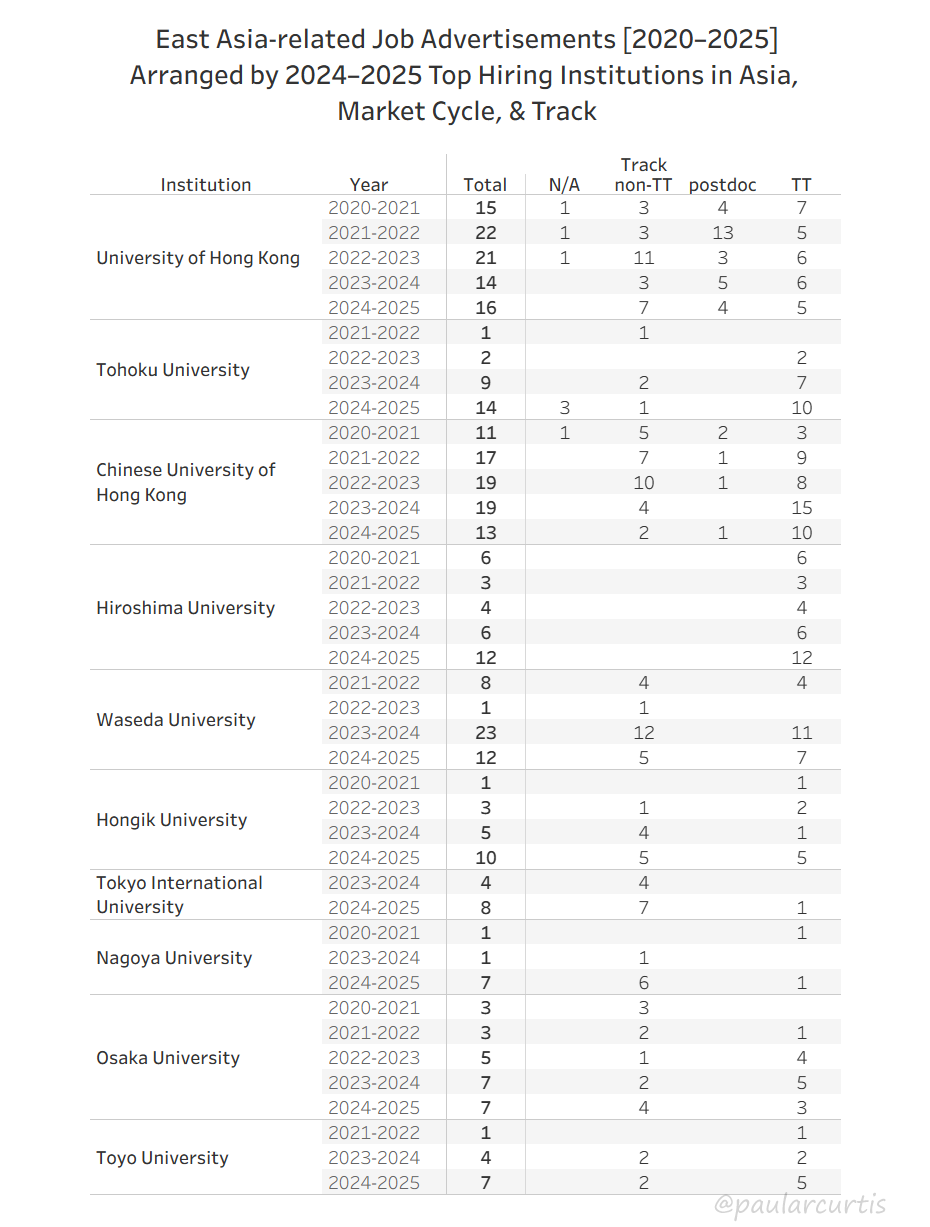
North America
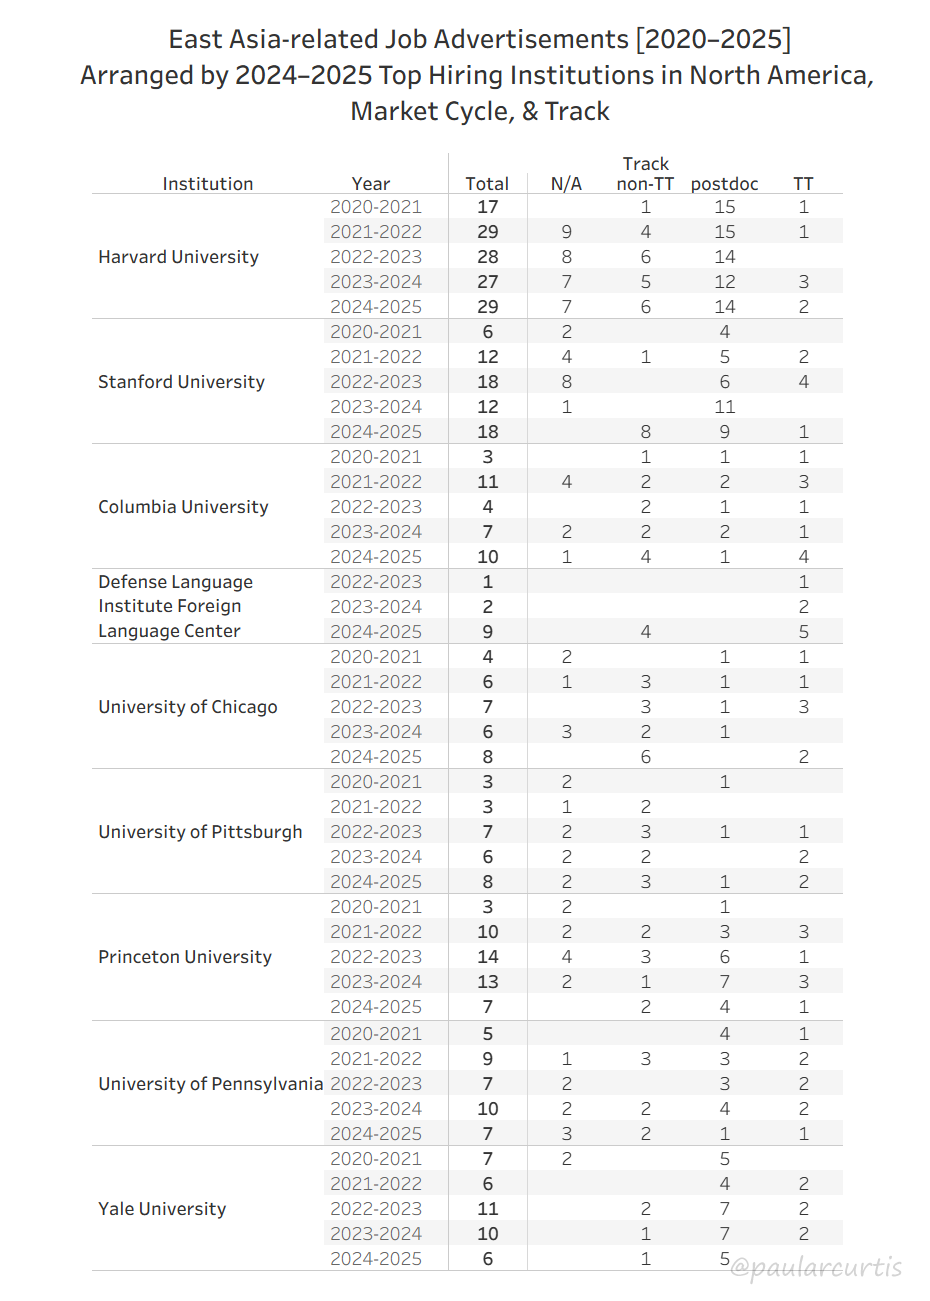
Europe
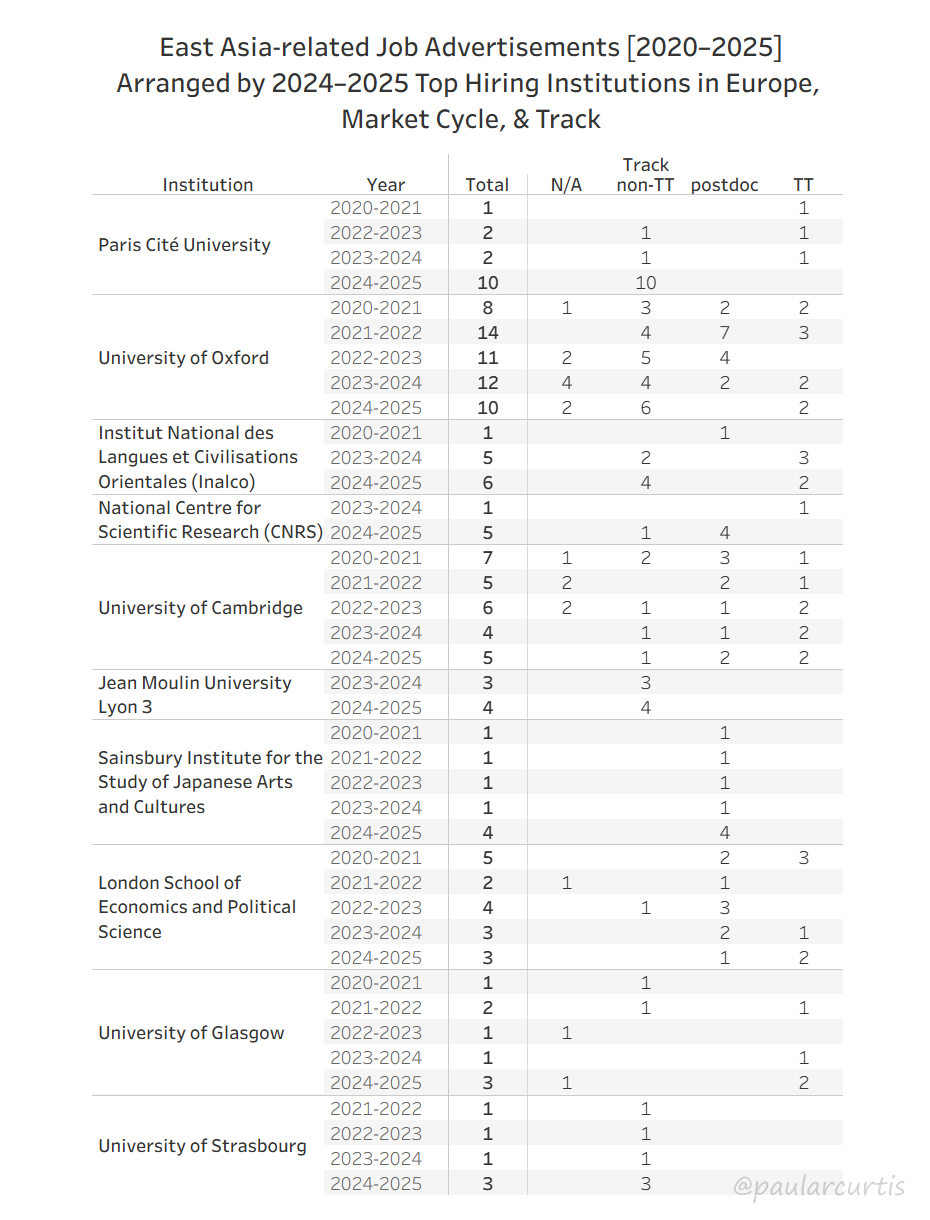
At institutions based in Europe for 2024–2025, the most job ads were released by Paris Cité University and University of Oxford (10 ads each), followed by INALCO (6 ads), CNRS and University of Cambridge (5 ads each), Jean Moulin University Lyon 3 and the Sansbury Institute for the Study of Japanese Arts and Culture (4 ads each), and the London School of Economics and Political Science, University of Glasgow, and University of Strasbourg (3 ads each). Note that all of these institutions are based in the United Kingdom and France, all are public, and there is a little more variation in terms of R1 and R2 institutions along with some government and institution representation. Institutions with four or more hires last year were also only based in the UK or France, although the two years before that Leiden was also among them. Collectively, the Europe-based institutions this year had a rate of 18.9% permanent positions versus 75.5% contingent (54.7% non-TT, 20.8% postdoc) and 5.7% N/A. These percentages are closer to that of North America than Asia, though less meaningful given the overall fewer number of job ads. At Paris Cité, all 10 of the jobs advertised were non-TT, while at University of Oxford there were 2 TT-equivalent roles, 6 non-TT ads, and 2 N/A ads. At INALCO, which had 6 ads total, 2 ads were permanent and 4 ads were non-TT.
Oceania
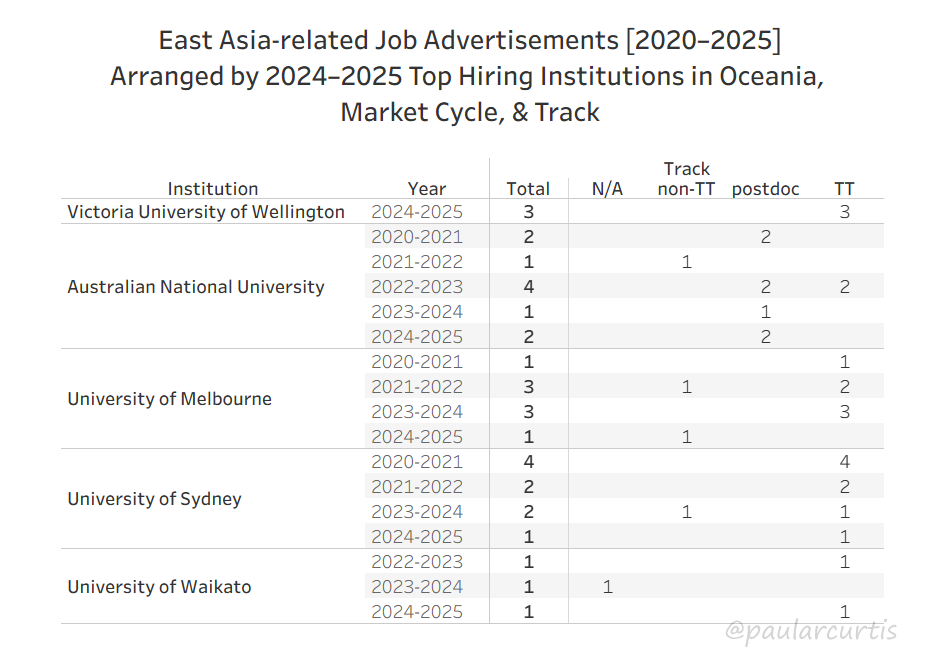
A Glimpse into Digital Labor
The majority of digital labor that goes into research projects and public facing scholarship is invisible, with the many hours spent crunching numbers, coding, or designing user interfaces or graphics unknown to the casual observer. For this reason I like to include descriptions of the labor that goes into this job data collection at the end of each report. Being transparent about our labor is crucial to not only educating others on how these projects are undertaken but also to facilitating a more equitable academia by freely providing that information. I have been collecting this job data for the last five years. In 2022, it was supported by an Association for Asian Studies and National Endowment for the Humanities Striving for Diversity, Equity, and Inclusion in Asian Studies Digital Humanities grant for one year. Nevertheless, this has meant four years of labor funded only through generous sponsorship by Patreon patrons.
This year in particular I feel I have much improved my data collection and curation, so I spent a significant amount of time—far more than in previous years—working and reworking my materials to effectively review and (re)clean the previous years’ data. This process allows me to be more consistent in my analyses, particularly multi year comparisons.
Over the course of the last five years I have searched for new postings on a weekly basis across over a dozen+ websites. I record them in my annual data file, clean up the data, select keywords from the advertisement to feature in the filter table, and then post a brief summary of the latest ads on social media. I also write a brief data report on my thoughts about trends in progress for patrons on my Patreon. This work is typically done on my Fridays and over the weekend.
I use the tool Timeular (now known as "Early") to track the hours I spend on my digital projects and other professional activities, particularly those for which I am (or am not) paid. To provide a rough estimate of how much time has been spent on my job data alone over the last year, I provide visualizations from my time tracking below.
patrons.
This year in particular I feel I have much improved my data collection and curation, so I spent a significant amount of time—far more than in previous years—working and reworking my materials to effectively review and (re)clean the previous years’ data. This process allows me to be more consistent in my analyses, particularly multi year comparisons.
Over the course of the last five years I have searched for new postings on a weekly basis across over a dozen+ websites. I record them in my annual data file, clean up the data, select keywords from the advertisement to feature in the filter table, and then post a brief summary of the latest ads on social media. I also write a brief data report on my thoughts about trends in progress for patrons on my Patreon. This work is typically done on my Fridays and over the weekend.
I use the tool Timeular (now known as "Early") to track the hours I spend on my digital projects and other professional activities, particularly those for which I am (or am not) paid. To provide a rough estimate of how much time has been spent on my job data alone over the last year, I provide visualizations from my time tracking below.
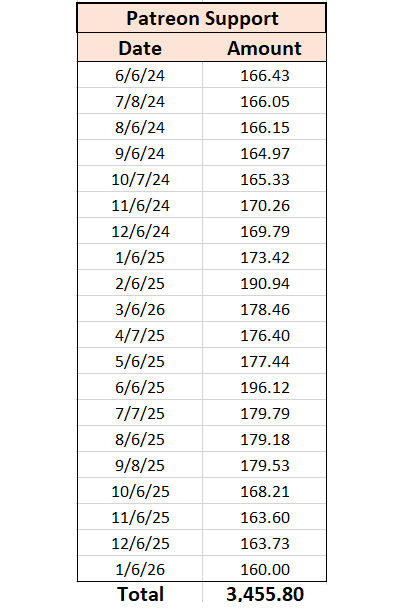 account to crowdsource financial support for this work a few years ago. Those that have decided to continue supporting this (and my other digital public-facing work that I still do for free) have generously provided about $160 to $175 per month (pre-taxes). From June 2024 to January 2026, this has totaled $3,455.80 over the roughly 1.5 year period. At the low end, I performed about $6,872.20 of uncompensated labor; at the high end, it would be about $15,478.20 of uncompensated labor.
If you found this or any other of my digital projects useful, monthly donations via Patreon begin at $2. Support from the community I do this for means a lot to me and helps with the cost of this site.
account to crowdsource financial support for this work a few years ago. Those that have decided to continue supporting this (and my other digital public-facing work that I still do for free) have generously provided about $160 to $175 per month (pre-taxes). From June 2024 to January 2026, this has totaled $3,455.80 over the roughly 1.5 year period. At the low end, I performed about $6,872.20 of uncompensated labor; at the high end, it would be about $15,478.20 of uncompensated labor.
If you found this or any other of my digital projects useful, monthly donations via Patreon begin at $2. Support from the community I do this for means a lot to me and helps with the cost of this site.
As always, I hope this report and the data therein will provide a starting point for discussions on old and new trends in the East Asian Studies field and may be of service to those who wish to advocate for the creation of such jobs at their own institutions. If you would like to discuss specific visualization requests for a subset of this dataset, you may contact me at prcurtis(at)g.ucla.edu. Please link and provide credit when reposting. If you post any graphics provided or screencaps of the interactive visualizations, please cite this page and/or tag me on social media (@paularcurtis.bsky.social on Bluesky).
To cite this page:
Curtis, Paula R. "East Asia-related Job Market Data Report (2024–2025)," prcurtis.com, January 20, 2026; http://prcurtis.com/projects/jobs2025/
-
Prior to the data updating and re-cleaning done this year, the total number of entries for the 2021–2022 cycle was 909 advertisements. More effective data curation thus incorporated about 100 new job ads into that year's dataset. ↩
-
For our purposes here, Art History/Architecture/Urban Studies, East Asian Studies, Education, Film Studies/Media Studies, Gender Studies/Sexuality Studies, History, Linguistics, Literature & Culture, Music/Musicology, Performing Arts/Drama, Philosophy, Public History, and Religious Studies. ↩
-
For our purposes here, Archaeology, Business/Economics, Digital Studies, Environmental Studies, Geography, Law, PoliSci/Anthro/Socio, Public Health. ↩