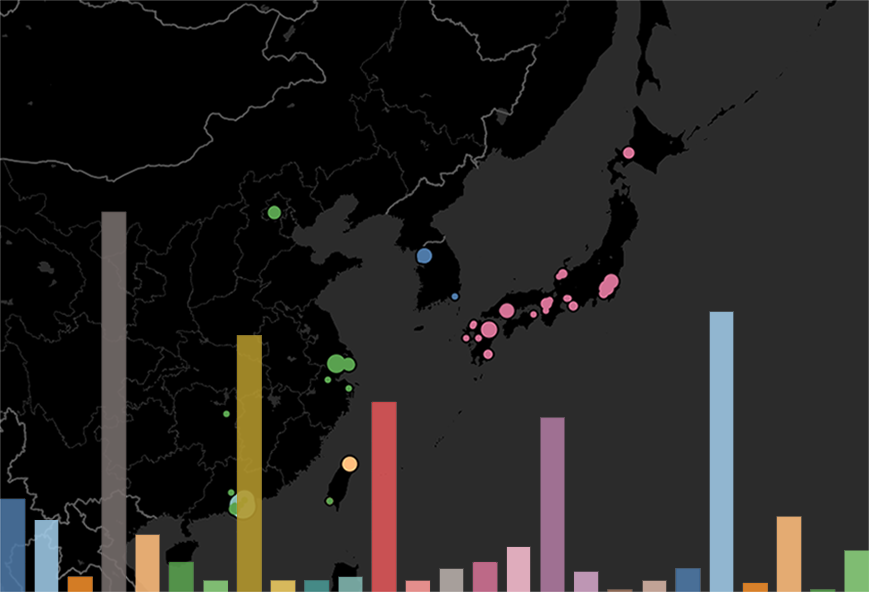
East Asia-related Job Market Data Report (2020-2021)
Published: July 5, 2021
This page compiles information and visualizations on academic-oriented job postings related to East Asia for the 2020-2021 season (from June to June).
For more information on how and why I began this project, please see my first visualization page for the 2019-2020 academic job cycle. For the sake of convenience and to address changes in my methods since last year, below I will reproduce my explanations on data collection from last year’s cycle, with new elements added in bold and/or marked with a star ★.
To jump directly to the visualizations, click here.
I hope that the information provided on this page will facilitate further dialogue on current and future developments in the field of East Asian Studies and can be used by departments and individuals to advocate for this area of study at their institutions.
About the Data: Sources
The data gathered for this exploration originated from several sites (★ newly incorporated this job cycle):
This data should NOT be considered 100% comprehensive (see caveats below), merely reflective of information provided on some of the most commonly-used job search portals for academic postings related to East Asia.
About the Data: Caveats
First, let me say that data is messy. This is a reflection on the job ads themselves, which are even messier. A job ad might ask for something fairly specific, like a historian of contemporary China focusing on the environmental humanities, or simply list “East Asian Studies” with no additional information on a desired time period, specialization, or other qualifications. Because job ads are inconsistent in the terminology used to describe some academic positions, I have chosen not to do a vocabulary-based comparison on desired disciplinary expertise. However, if you are interested in exploring the key terms that appeared in job ads for this year’s market cycle, you can find a searchable table of them here. For the purposes of producing this dataset, job ad language was taken at face value, and cannot account for any internal criteria that informed the scope of searches. How data is represented is also interpreted through the compiler. Others might have organized or categorized this data differently than I have.
Although I have expanded my use of job search sites significantly this year and solicited postings from colleagues outside of Anglophone circles, the data presented here is also reflective of both an English-language and North American bias, as many of the sites examined tend to focus on those positions, and others presented in other languages are only infrequently submitted to these venues. Some postings also may pass through informal channels only or through alternative lists to which I do not have access. Furthermore, some schools either do not or cannot afford to post their job openings through more widely-known channels.
This list also may not be exhaustive with regards to jobs that one might consider “alt-ac” or “academic adjacent,” as I focused to the best of my ability on those ads that readily circulated on academic job searching platforms. In some cases, job postings may have been removed after their deadline passed or when the position was filled, leading to the disappearance of more specific information on their content.
This year I incorporated job advertisements posted between June 1, 2020 and June 30, 2021. This differs from the previous cycle, which was for advertisements posted between June 1, 2019 and April 29, 2020 (all collected during spring 2020). The time frames differ because I only decided late into spring 2020 that I would embark on this project and was uncertain about the best parameters for collection. This year I determined that collection through the month of June would best reflect the academic job market cycle.
About the Data: Cleaning and Organization
In an effort to produce meaningful visualizations comparing different job ads, I created eight different data categories. A new core category has been added this year: Continental Region. To review what each category and its accompanying labels mean (and how they were determined), click each of the tabs below.
The geographic location of the hiring institution.
The continental region in which the hiring institution is located.
The geographic regional coverage for which the job ad identified a preference. East Asian Studies and many humanities fields cite a primary region or nation of interest in their advertisements, whereas many social science fields have begun to replace regional or national focus with methodological preferences. This category was narrowed down from the ad content when possible. For example, if an ad listed “East Asian Studies/Asian Studies” for the title or topic of the position, but specified “preference for a candidate who can teach modern China,” then this posting’s “desired region” was labeled as “China.” Ads that included a particular combination of locations, such as “Asia/Africa” are identified separately. Job ads that were vague, such as positions in “non-Western” or “global” studies were not included. Northeast Asia was the central focus of job data collected. - Asia (Pacific) ★
- Asia, Africa
- China
- China, Inner Asia ★
- China, Japan
- China, Africa ★
- China, Korea ★
- China, South Asia
- China, Southeast Asia ★
- East Asia, Asia
- Hong Kong ★
- Hong Kong, China ★
- Japan
- Japan, Korea
- Korea
- Taiwan
Data on the desired discipline identified in job ads was divided into labels that best distinguish the responsibilities of the position, based on the department hiring and/or description of the qualifications. Disciplines for which few postings were area-specific or that often advertise together (such as Political Science, Anthropology, and Sociology) are combined in the interest of visual legibility. The social sciences, in particular, pose challenges to data collection, as they do not often advertise region- or nation-specific positions. Another challenge division is “Literature & Culture” and “East Asian/Asian Studies.” Often generalist positions in East Asian Studies are filled by specialists in literature and culture, complicating this division. Here, I have chosen to separate general positions that do not list a specific interest in literature/culture from job ads that specifically ask for a literature/culture specialist. Similarly, although there is often overlap between generalist instructors and language instructors at small institutions, the “Language” category applies to jobs exclusively looking for language instructors, and those seeking sub-specialization in translation, interpretation, or linguistics have been given their own category this year. Eleven categories were altered or added this year (marked with a ★). These changes add more variety and clarity to the disciplinary categories included.
- Administration, Program Director
- Any ★
- Archaeology
- Art History, Architecture, Urban Studies
- Business/Economics ★
- Curator
- Digital Studies ★
- East Asian, Asian Studies
- Film Studies, Media Studies
- History
- Interpretation ★
- Language
- Librarian, Library Services ★
- Linguistics ★
- Literature & Culture
- Museum, Curator, Conservation ★
- Music, Musicology ★
- Philosophy ★
- PoliSci, Anthro, Socio
- Public Health ★
- Religious Studies
- Social Studies/Education
- Theatre, Performing Arts ★
The time period of the specialist desired in the job advertisement. - modern
- premodern (early modern [c. 18th/19th cen] and before)
- any (not specified or no preference)
- N/A (e.g.: language instructors)
The track/security of the position. Contingent positions have been divided into jobs that are non-tenure track positions and postdocs, as the former typically applies to visiting or contracted positions and the latter often applies to research positions, sometimes with minimal teaching responsibilities. Adjunct positions, being extremely difficult to track and variable in their contract terms, are not included in this data. - TT (tenure track)
- non-TT (non-tenure track, including jobs to which this term does not apply)
- postdoc (non-tenure track, contingent position)
The labeling of institutions is based on its research output and degree-granting programs. This is perhaps the most problematic of the data organized, as, for the sake of comparison, each institution has been forced to fit into the rough equivalent of the US categories based on The Carnegie Classification of Institutions of Higher Education. The Carnegie classifications do NOT consistently correlate with institutional rankings (also problematic). For UK-based institutions, I established R1 equivalents based on the Russell Group categories, and for Australia, the Group of Eight. For universities in Asia and Europe, I consulted with colleagues based in those areas and provided a best guess based on anecdotal advice. I fully acknowledge that these distinctions are problematic and are often considered subjective. The most meaningful observations may be derived from considering the extremes-- whether jobs appear more often at very large doctoral degree-granting institutions or small liberal arts institutions. Three new categories have been added to reflect the different types of institutions where jobs are available that may be outside the academic or tenure-track system system. - R1 - very high research, doctoral program
- R1 regional branch - branch campuses of R1 institutions located in the US or abroad
- R2 - high research, doctoral program
- D/PU - Doctoral/Professional Universities
- M1 - high research, masters program
- M2 - medium research, masters program
- SLAC - small liberal arts college
- CC - community college ★
- museum/archive - museum or archive ★
- non-profit - non-profit organization ★
- N/A
The type of institution. N/A indicates it is something different from a typical academic degree-granting institution, such as a language training school, etc. - public
- private
- N/A
The Data
Please review the caveats and labeling system provided above before viewing the data in order to best understand how and why it has been cleaned and organized as presented below. Please note that because my period of data collection changed and my methods improved, a one-to-one numeric comparison with last year's data may not be wholly advisable. Below, I have created several (non-exhaustive) visualizations based on my data using Tableau Public. Please note that postdocs were counted by the number of positions offered at a single university. For example, Yale University’s Council on East Asian Studies hires four postdocs per year for its general CEAS postdoc, so this is counted as four positions.The data collected for the 2020-2021 academic job cycle totaled 631 job advertisements globally. Of these advertisements, the majority (288 total) were openings at North American institutions. Asia was the second highest employer, with 210 total advertisements. 121 ads were released in Europe and 12 in Oceania.
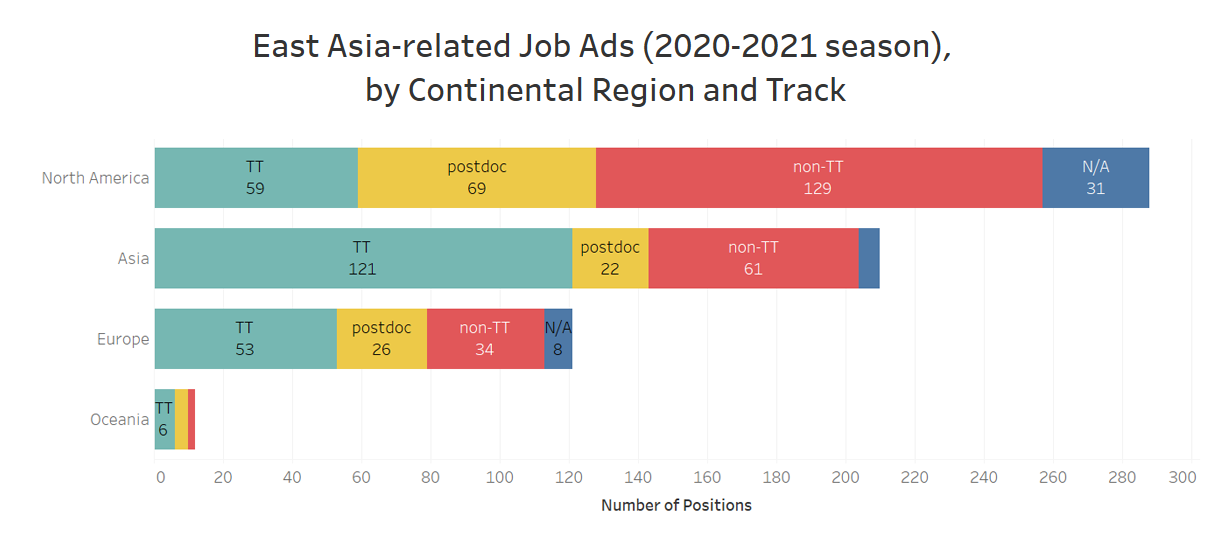
Asia: 217 (+7)
Europe: 139 (+18)
Oceania: 12 (+0) Final contingency rates by continent (postdocs + non-TT): North America: 203 of 295 (68.8%)
Asia: 83 of 217 (38.2%)
Europe: 72 of 139 (51.8%)
Oceania: 6 of 12 (50%)
The following visualization is an interactive map of all East Asia-related job postings by discipline, time period, track, and location. Clicking on information anywhere on the visualization or on the map below will generate its linked data across other fields. Hover over data points on the map to reveal information on the data point provided. Zooming in or out is also possible. Points on the map are sized to frequency, so a place with more jobs postings will appear larger than other points. Click the title of the subcategory you're filtering or the area of the visualization you originally selected to void your selection and start over. Tableau Public can be finicky, so it may take a little experimentation. If interactive visualizations lag or generate an error, please refresh the page.
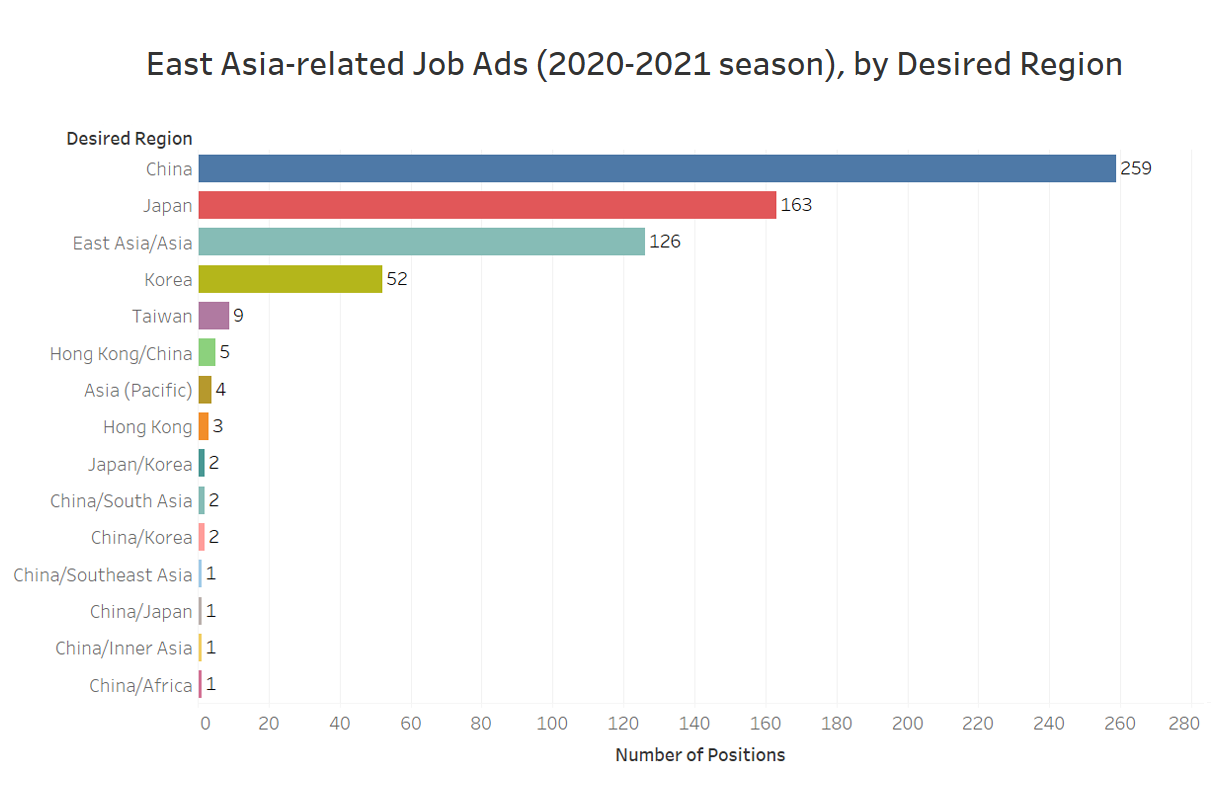
East Asia/Asia: 130 (+4)
Japan: 168 (+5)
Korea: 56 (+4)
Hong Kong: 4 (+1)
China/Africa: 2 (+1)
The visualizations below, reflecting job advertisements globally, provide a selection of comparative perspectives across regional and disciplinary specialization, with a focus on Northeast Asia and the humanities. As explained in the "About the Data" section above, many new categories were added this year to allow for greater specificity regarding disciplinary interests. Language instruction (addressed in detail below) was the highest in demand across the desired regions of China, Japan, and Korea.
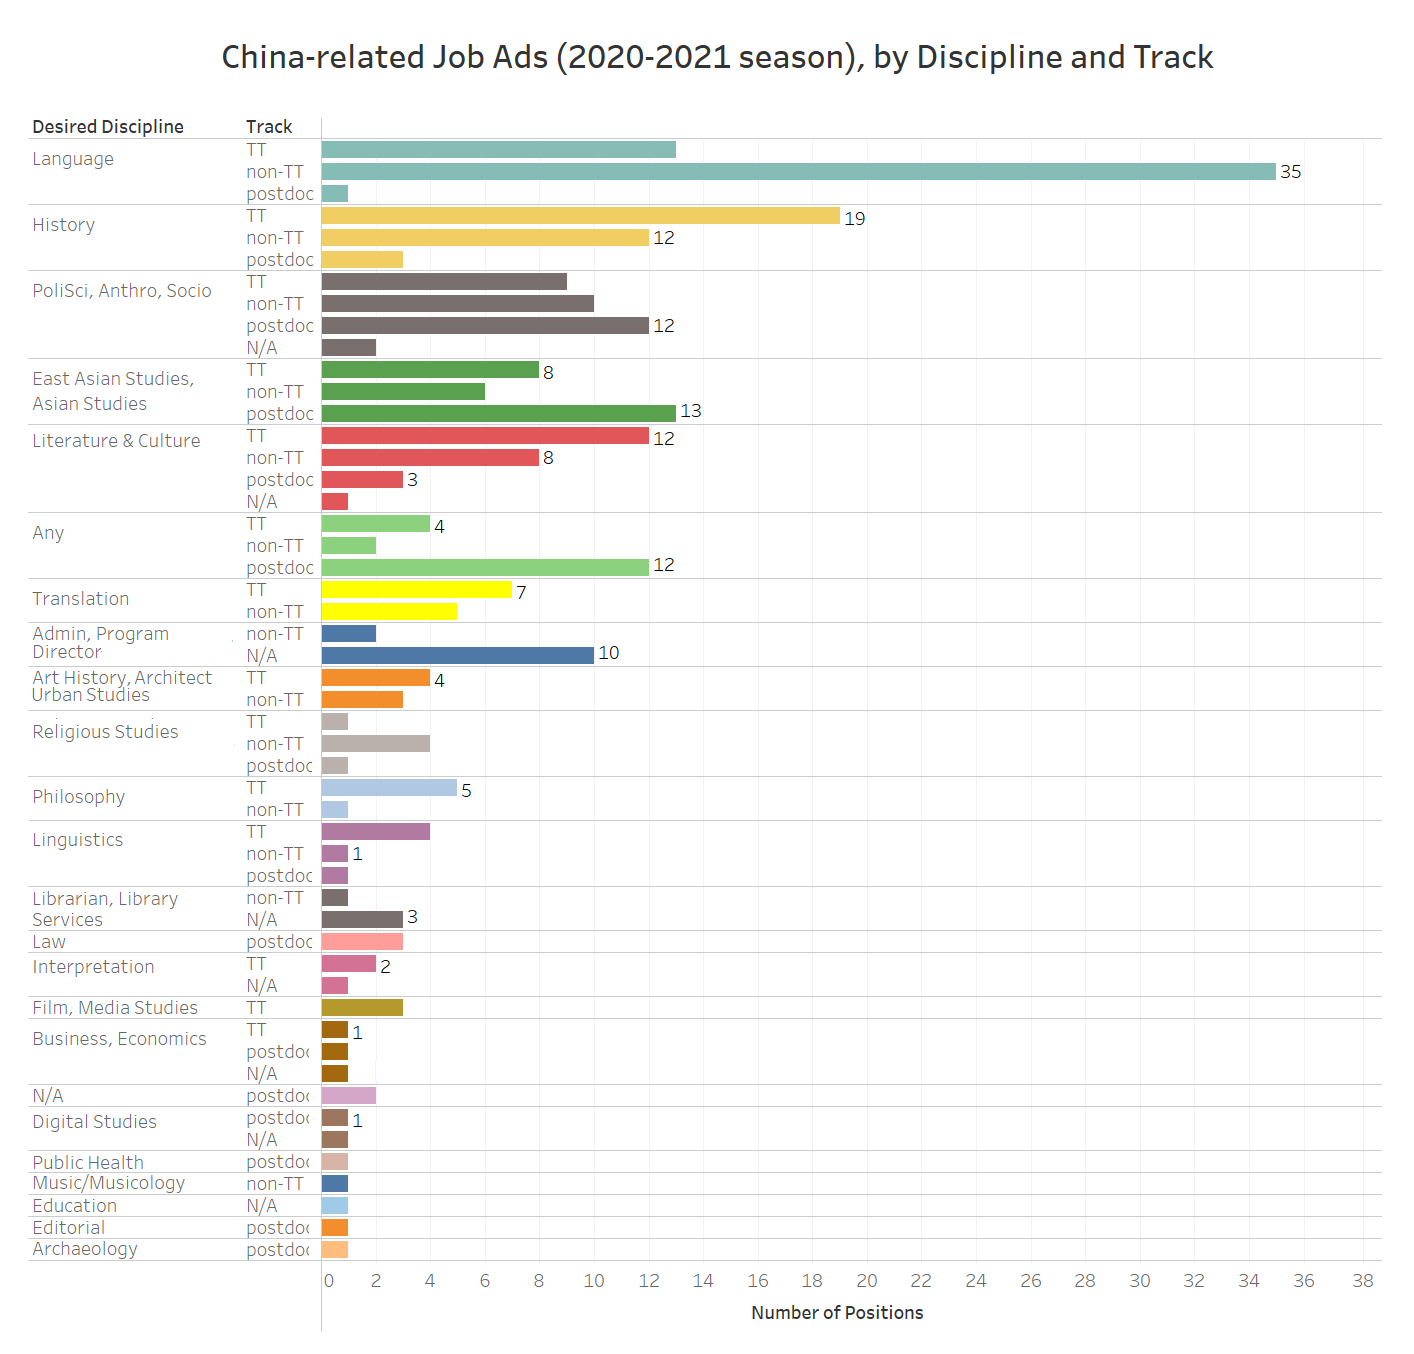
East Asian Studies: 29 (+2)
Literature & Culture: 25 (+1)
Digital Studies: 4 (+2)
Language: 51 (+2)
Translation: 16 (+4)
Linguistics: 7 (+1)
Film/Media Studies: 3 (+1)
Archaeology: 2 (+1)
Admin/Program Director: 15 (+3)
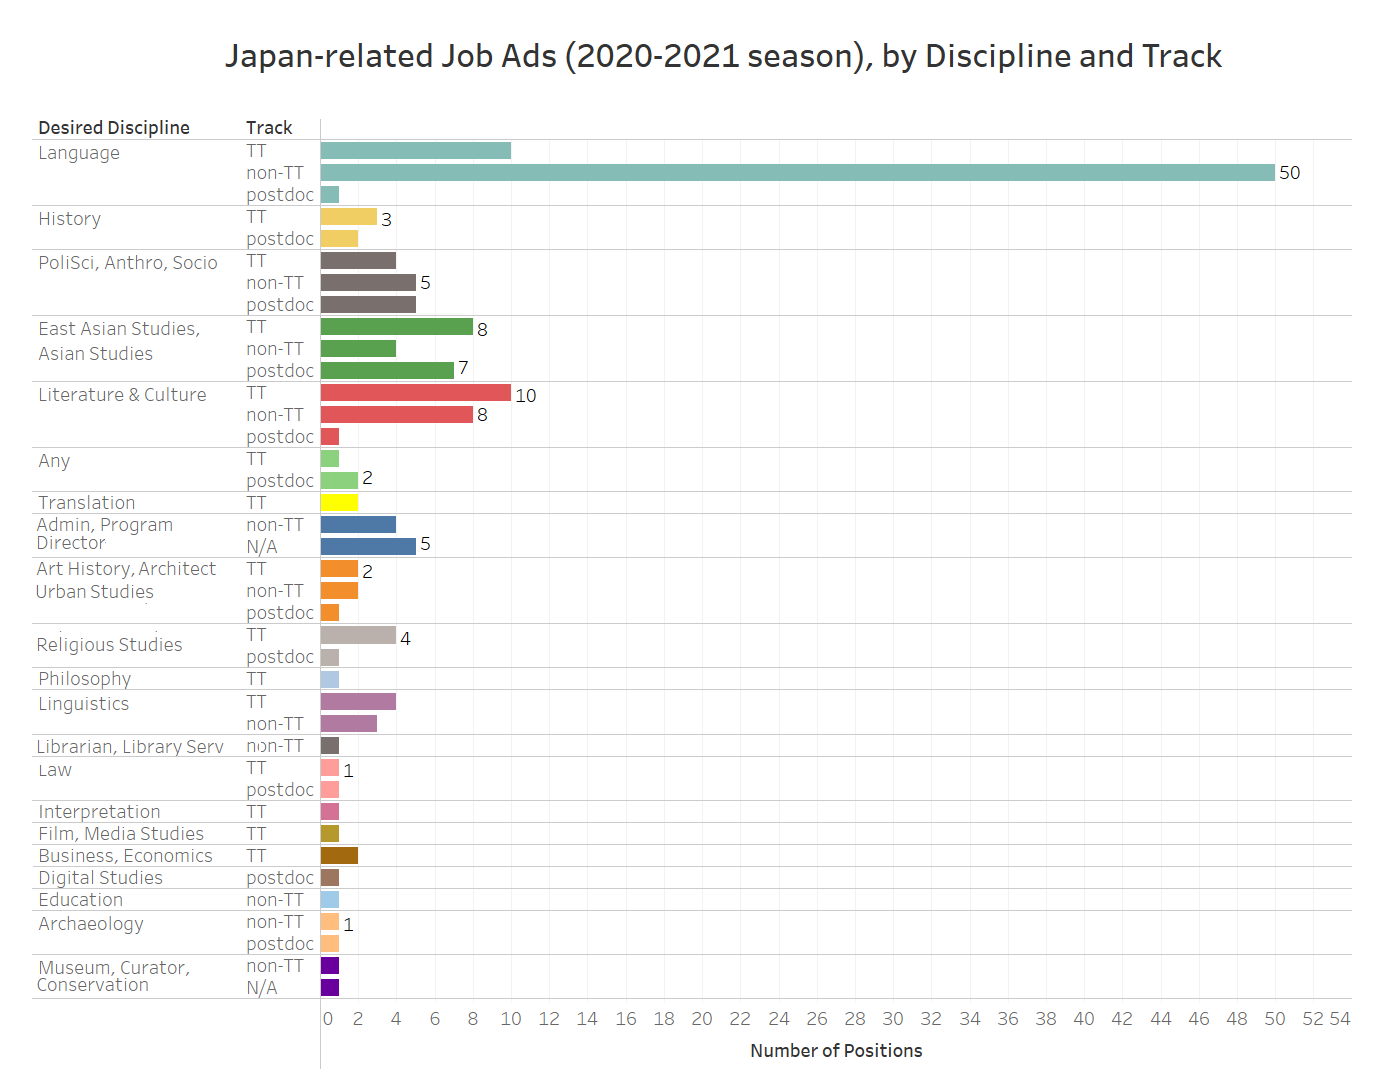
Film/Media Studies: 2 (+1)
Any: 4 (+1)
Admin/Program Director: 10 (+1)
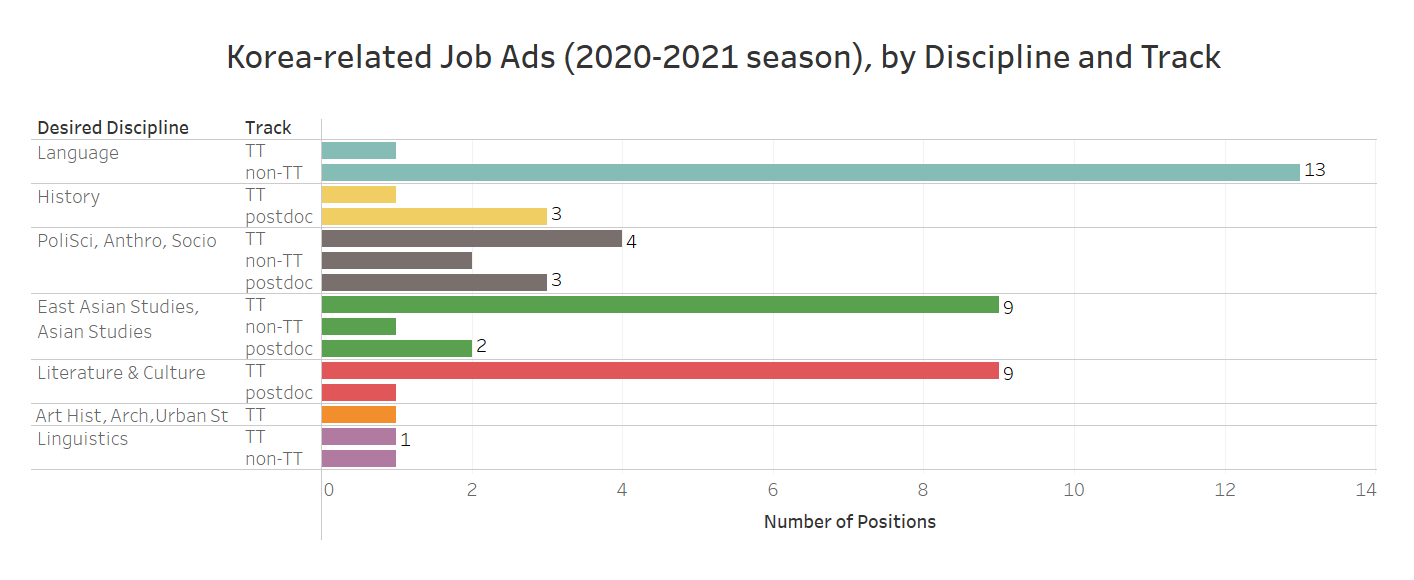
Language: 16 (+2)
Below are a handful of discipline-specific observations on the History, East Asian/Asian Studies, Literature & Culture, and Language fields. These fields are often discussed as markers of the "health" of area studies as a whole, and so it is worth highlighting some specific trends that appeared this job cycle.
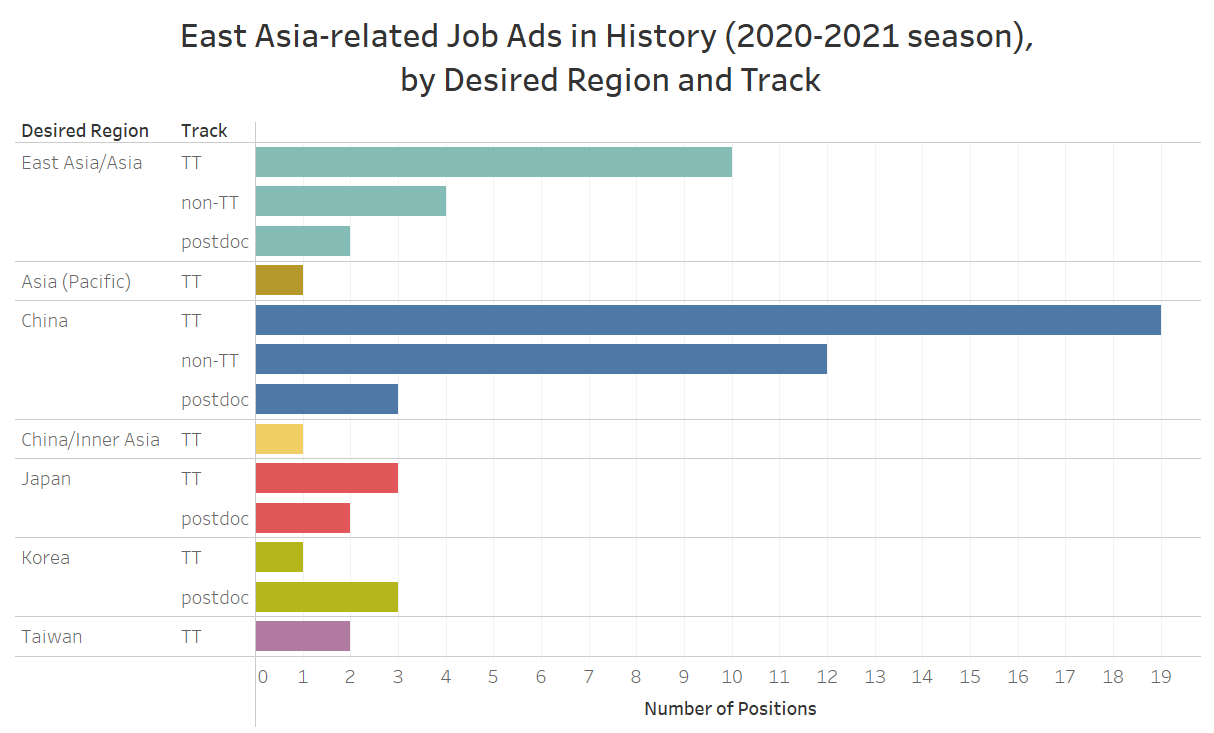
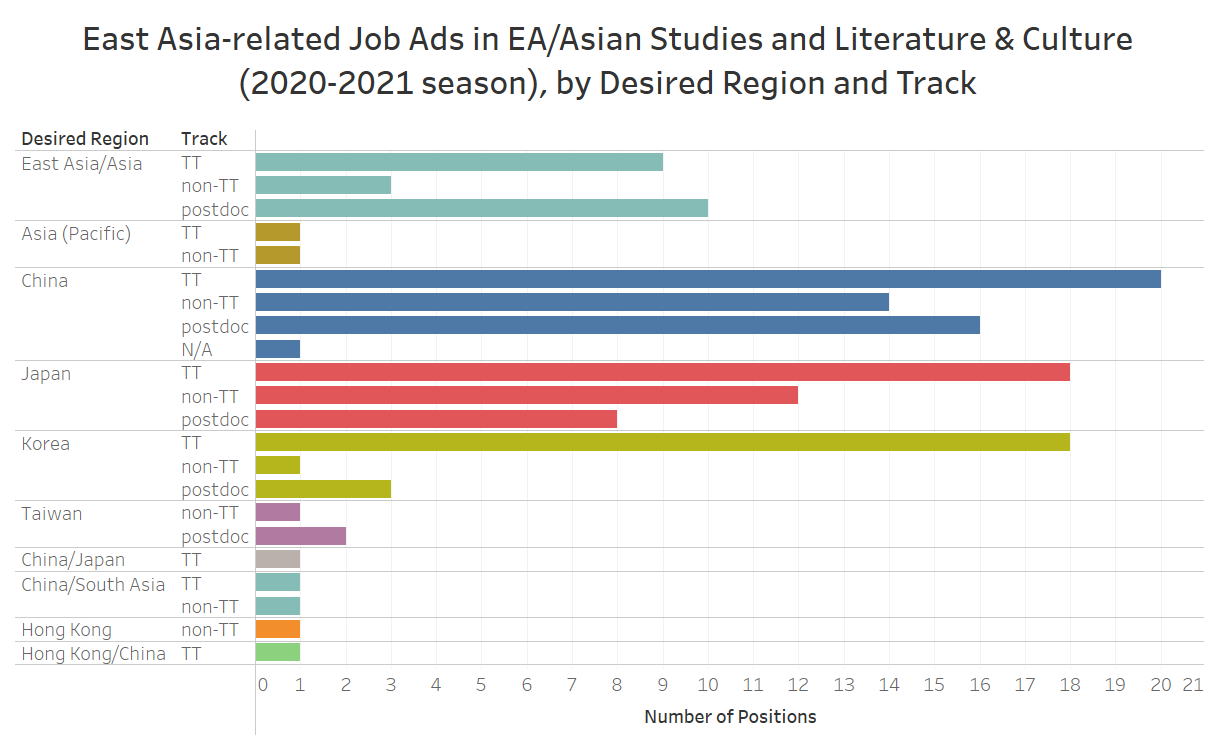
Japan: 38 (+0)
Korea: 22 (+0)
East Asia/Asia: 22 (+0)
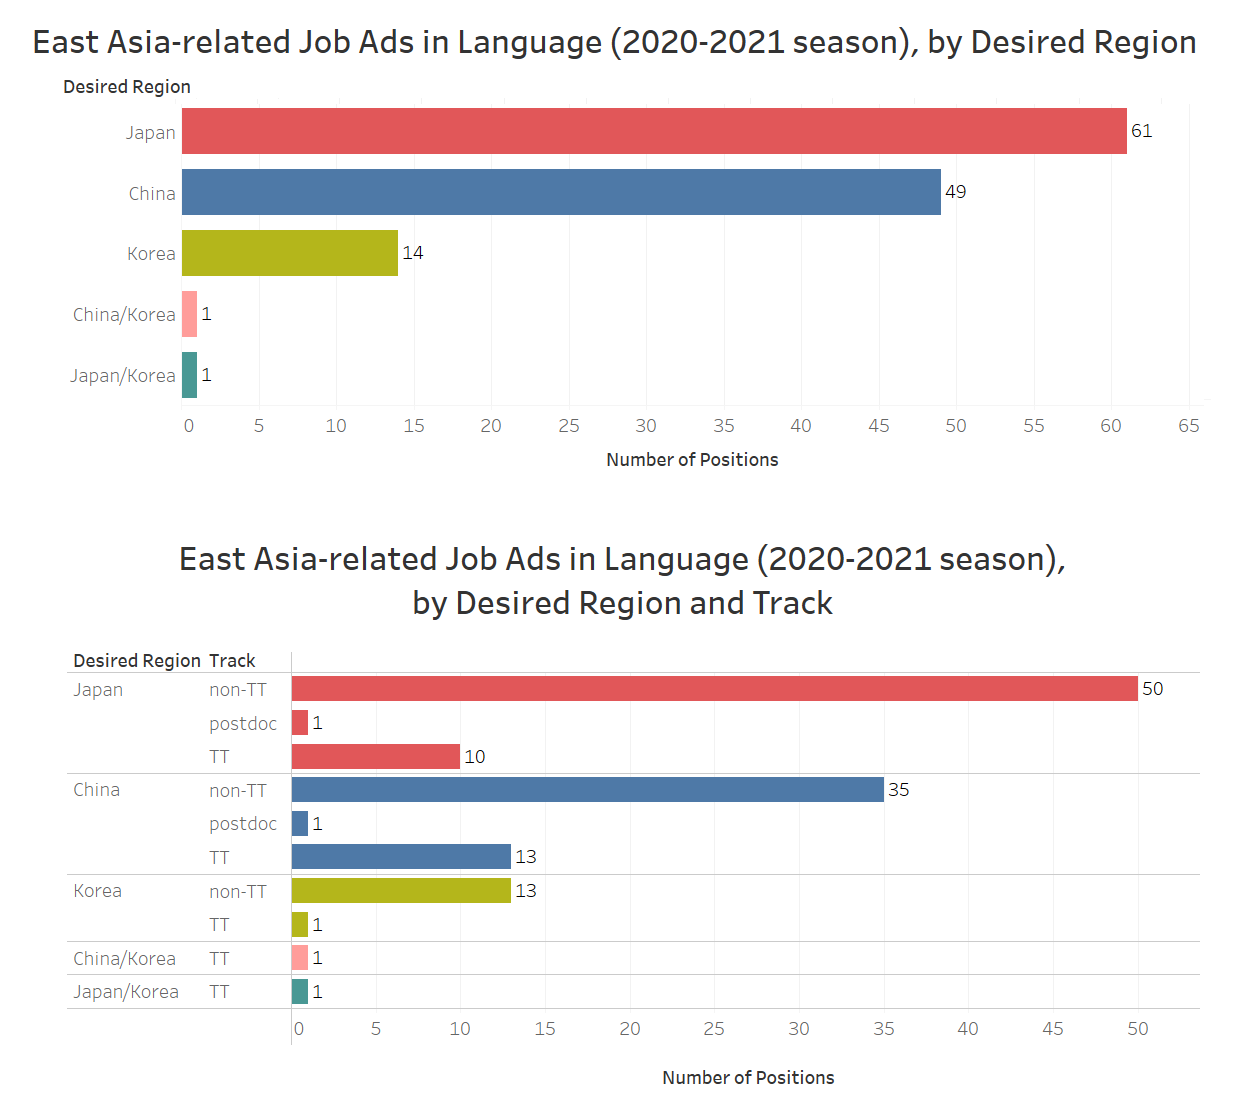
China: 51 (+2)
Korea: 16 (+2)
China/Korea: 1 (+0)
Japan/Korea: 1 (+0)
And the rates of contingency mentioned: United States:
contingent labor: 73 (+1)
tenure-track: 4 (+1)
Global tenured ad rate: 21%
Global contingent ad rate: 79%
modern : 32 (+0)
premodern: 4 (+1)
any: 49 (+1)
History
modern : 27 (+2)
premodern: 14 (+0)
any: 24 (+0)
Literature & Culture
modern : 19 (+0)
premodern: 13 (+1)
any: 25 (+0)
PoliSci/Anthro/Socio
modern : 87 (+2)
premodern: 0
any: 7 (+0)
Film Studies/Media Studies
modern : 7 (+2)
Digital Studies
modern : 2 (+1)
Any: 1 (+0)
N/A: 3 (+1)
Archaeology
premodern: 6 (+1)
Any
modern: 9 (+0)
any: 16 (+1)
The breakdown of ads by desired Time Period and Region (with changes, excluding language-related ads) for the 2020-2021 cycle is: China
modern: 80 (+2)
Premodern: 33 (+3)
any: 53 (+1)
East Asia/Asia
modern: 51 (+2)
premodern: 6 (+0)
any: 47 (+1)
Japan
modern: 33 (+1)
premodern: 6 (+0)
any: 40 (+1)
Korea
modern: 22 (+0)
premodern: 2 (+0)
any: 12 (+0)
As with the 2019-2020 season, R1 (very high research) institutions offered the most jobs for this cycle (326 total). This was followed (though with a wide margin) by small liberal arts colleges (SLACs), which had 88 job advertisements. R2 institutions (79 total) and D/PU institutions (70) were next, given that both grant PhDs.
SLAC: 89 (+1)
R2: 82 (+3)
D/PU: 73 (+3)
M1: 11 (+2)
United States
145 R1 ads with 107 contingent (73.8% contingent)
57 SLAC with 39 contingent (68.4% contingent)
United Kingdom
68 R1 ads with 36 contingent (52.9% contingent)
Japan
21 R1 ads with 11 contingent (52.4% contingent)
11 SLAC with 39 contingent (63.6% contingent)
Hong Kong
29 R1 ads with 14 contingent (48.3% contingent)
12 SLAC with 2 contingent (16.7% contingent)
private: 236 (+6)
N/A: 17 (+0)
United States
private: 162 (+4)
public: 100 (+3)
United Kingdom
private: 1 (+0)
public: 93 (+16)
Hong Kong
private: 1 (+0)
public: 56 (+3)
Japan
private: 26 (+1)
public: 38 (+0)
Addendum Summary
After the completion of this job data report I continued to collect advertisements for the 2020-2021 cycle that were posted late into the season. This included 31 job advertisements of various types and locations. In addition to the “addendum” buttons now included throughout this page that hone in on specific comments about the data, below I provide an interactive visualization of the 31 job ads in the event that the addenda above did not provide all the information desired.A Glimpse into Digital Labor
Much of digital labor is invisible and often unpaid. In spring of 2021 I purchased a Timeular device to help track (and balance!) how many hours I regularly spent on my digital projects, writing projects, and other public-facing activity. Here I would like to briefly describe and quantify the labor involved in order to be transparent about what kind of investment this sort of work entails.
A new feature to my data collection this year was an interactive table of the job listings being collected. Numerous people had asked whether or not I was sharing my data as I compiled it, and I realized it would benefit others for information on these job postings to be readily available each week (and I could spread out the labor of data cleaning over a regular period of time). Therefore, every Saturday morning I scoured job websites, input the data into my master sheet, and then reformatted it (with additional advertisement keywords) on the interactive table. I also began to regularly post how many hours a week I spent doing this.
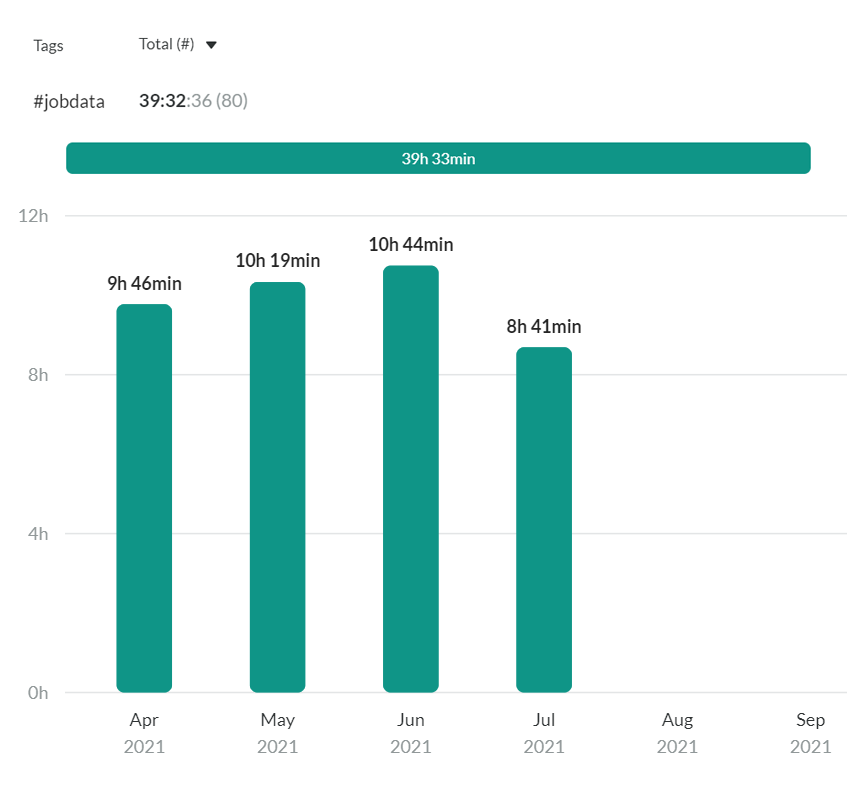
Given that I only began this tracking process in late March 2021, I only have complete, full-month data records for April, May, and June. On average, I spent about 13.5 hours a month doing digital projects (including Shinpai Deshou and my East Asian Studies resources database), and 10.25 hours per month on job data specifically.
Based on these numbers, by the end of the year I will likely have spent about 123 hours on job data collection. If we were to assume such work was paid on the low end at $25 an hour, I will have done $3,075 worth of labor ($256.25 of work monthly). At the urgings of colleagues who knew how much time I spent on digital projects in service to the field, I began a Patreon account in February 2021, through which patrons currently sponsor approximately $135 a month (pre-taxes). In exchange, each week they receive preview reports of data collection in progress.
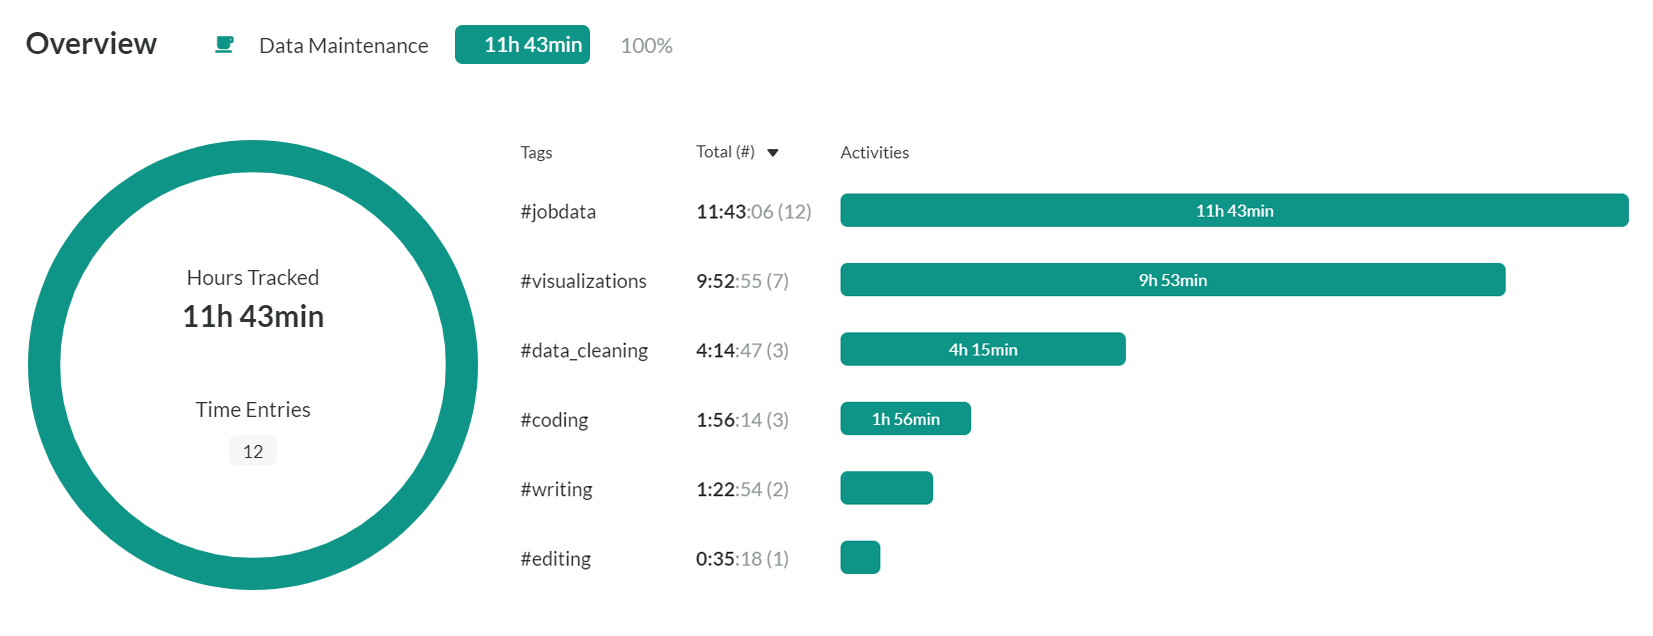
As for the creation of this report, I tracked 11.75 hours total (approximately $293.75 of labor), which were used for writing, coding, final data cleaning, and the creation of visualizations. The final product was time intensive, as I spent time reflecting on last year’s report, articulating changes I had made, making improvements to the visualizations, re-coding the new page, and inevitably finding errors that required the correction of visualizations late into preparation (ah, the data life!).
If you found this project useful, please consider supporting the data and writing labor via Patreon  . Support from the community I do this for means a lot to me and helps keep this site running.
As explained above, because of changes to my data collection and curation methods it is difficult to compare this year’s job season with the 2019-2020 market. Nevertheless, the above data are instructive in their own right. I hope it will provide a starting point for discussions on old and new trends in the East Asian Studies field and may be of service to those who wish to advocate for the creation of such jobs at their own institutions. If you would like to discuss specific visualization requests for a subset of this dataset, you may contact me at prcurtis@umich.edu.
Please link and provide credit when reposting. If you post any graphics provided or screencaps of the interactive visualizations, please cite this page and/or tag me on social media (@paularcurtis on Twitter).
To cite this page:
Curtis, Paula R. "East Asia-related Job Market Data Report (2020-2021)," prcurtis.com, July 5, 2021; http://prcurtis.com/projects/jobs2021/
-
Jobs ads that specified a "global" or "world" focus where Japan was listed among numerous other options (such as the York University ad) were not included here. ↩